python matplotlib fig = plt.figure() fig.add_subplot()
一、matplotlib.pyplot.figure()
Create a new figure, or activate an existing figure.
matplotlib官网
功能: 创建一个新的图形 或激活一个已有的图形
**注意: 若不添加描述,默认图形描述为figure1; **
形如plt.figure(‘新的图形’)为图形添加自定义描述
(1)figure语法说明
figure(num=None, figsize=None, dpi=None, facecolor=None, edgecolor=None, frameon=True)
num: 图像编号或名称,数字为编号 ,字符串为名称
figsize: 指定figure的宽和高,单位为英寸;如figsize=(5,4)
dpi: Dots Per Inch 指定绘图对象的分辨率,即每英寸多少个像素,缺省值为80 。 若设置dpi=20, 则画面会非常模糊。(1英寸等于2.5cm,A4纸是 21*30cm的纸张)
facecolor: 背景颜色
edgecolor: 边框颜色
frameon: 是否显示边框
二、在figure中添加子图
没有add_subscatter(), add_subplot()意为添加子图并设置子图在整个figure中的位置,至于图的类型设置为下一步
add_subplot(nrows,ncols,sharex,sharey,subplot_kw)

三、简单示例
import numpy as np
import pandas as pd
from pandas import Series, DataFrame
import matplotlib.pyplot as plt
from matplotlib.font_manager import FontProperties
# 从本地字体集中导入‘宋体’,以免出现汉字乱码的情况
font_set = FontProperties(fname=r"c:\windows\fonts\simsun.ttc", size=15)
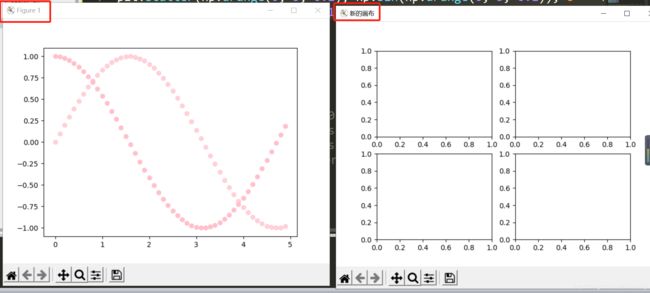
# 在"figure1"中创建一个带有散点图
# sin和cos 同时存在一个图中,使用label参数区分;alpha:RGBA空间中用于控制不透明度的值,范围为0-1;
plt.scatter(np.arange(0, 5, 0.1), np.sin(np.arange(0, 5, 0.1)), c = 'Pink', label = 'sin', alpha = 0.7)
plt.scatter(np.arange(0, 5, 0.1), np.cos(np.arange(0, 5, 0.1)), c = 'Pink', label = 'cos')
# 添加一个新的figure
fig = plt.figure('新的画布')
# 在新的figure中创建两行两列的四子图, 并且标注位置
fig.add_subplot(2,2,1)
fig.add_subplot(2,2,2)
fig.add_subplot(2,2,3)
fig.add_subplot(2,2,4)
plt.show()
四、为图添加网格
plt.grid(color, alpha, linestyle, linewidth)
# -------左下角
fig.add_subplot(2,2,3)
# 类型为折线图
plt.plot(x, pow(x,2))
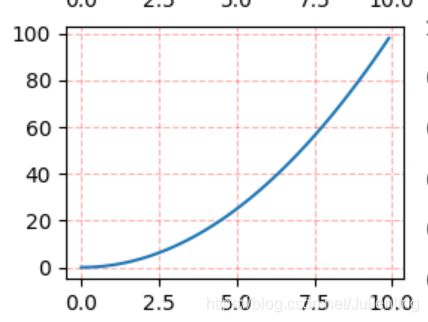
plt.grid(color = 'red', alpha=0.3, linestyle='--', linewidth=1)
linestyle = ‘–’ (网格为虚线) ; linewidth=1(默认)

linestyle = ‘–’ (网格为实线) ; linewidth=1(默认)

linestyle = ‘–’ (网格为虚线) ; linewidth=2 (线的宽度)

五、复杂示例
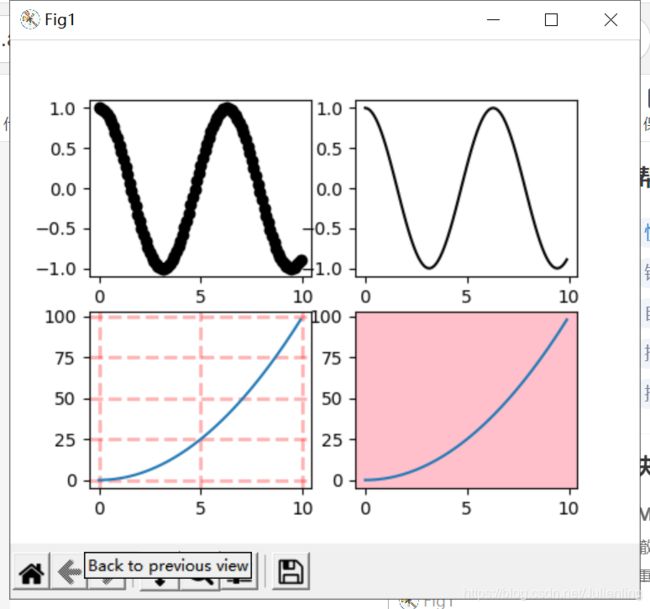
x = np.arange(0,10,0.1)
fig = plt.figure('Fig1',figsize=(5,5))
# 左上角图
fig.add_subplot(2,2,1)
plt.scatter(x, np.cos(x), c = 'Black', label = 'cos')
# 右上角图
fig.add_subplot(2,2,2)
plt.plot(x, np.cos(x), c = 'Black', label = 'cos')
# 左下角
fig.add_subplot(2,2,3,)
plt.plot(x, pow(x,2))
plt.grid(color = 'red', alpha=0.3, linestyle='--', linewidth=2)

# 右下角,设置子图背景色为粉色
fig.add_subplot(2,2,4, facecolor='pink')
plt.plot(x, pow(x,2))
六、add_subplot() & subplot()

只有使用plt.legend()才能为每条线生成一个用于区分的图例。(无论是否又label选项都要调用plt.legend 来生成图例,若只设置了label, 不调用plt.legend(),则图例不显示。类似于HTML中标签)
subplot()的官方描述:
Add an Axes to the current figure or retrieve an existing Axes.
This is a wrapper of Figure.add_subplot which provides additional behavior when working with the implicit API .
译作:plt.subplot()是Figure.add_subplot ()的封装器,用于隐式API。
二者作用相同,只是使用不同
import matplotlib.pyplot as plt
Figure = plt.figure()

Figure.add_subplot()
# 等价于
plt.subplot

Figure.set_xlabel()
# 同样等价于
plt.xlabel()

Figure.set_ylabel()
# 同样等价于
plt.ylabel()
七、添加图例
一条legend只对一个图有作用,且只对图中出现的label 有注释,注释显示在图内
1、语法:
plt.legend(loc = ’ ', shadow = True / False, fontsize = 'x-large)
2、参数
loc = ‘upper right’ 右下角

官方示例
import numpy as np
import matplotlib.pyplot as plt

# Make some fake data.
a = b = np.arange(0, 3, .02)
c = np.exp(a)
d = c[::-1]

# Create plots with pre-defined labels.
fig, ax = plt.subplots()
# k 是blacK的意思, --表示虚线, : 表示点线
ax.plot(a, c, 'k--', label='Model length')
ax.plot(a, d, 'k:', label='Data length')
ax.plot(a, c + d, 'k', label='Total message length')

legend = ax.legend(loc='upper center', shadow=True, fontsize='x-large')

# Put a nicer background color on the legend.
legend.get_frame().set_facecolor('C1')

plt.show()
示例
import numpy as np
import pandas as pd
from pandas import Series, DataFrame
import matplotlib.pyplot as plt
from matplotlib.font_manager import FontProperties

# font_set = FontProperties(fname=r"c:\windows\fonts\simsun.ttc", size=15)

x = np.arange(0,10,0.1)
fig = plt.figure('Fig1',figsize=(10,10))
# 左上角图
fig.add_subplot(2,2,1)
plt.plot(x, np.cos(x), 'k:', label='cos')
plt.legend(loc='upper center', shadow=True, fontsize='x-large')

# 右上角图
fig.add_subplot(2,2,2)
plt.plot(x, np.cos(x), 'k:', label='cos')
plt.legend(loc='upper right', shadow=True, fontsize='x-large')

# 左下角
fig.add_subplot(2,2,3,)
plt.plot(x, np.power(x,2), 'k--', label='pow')
plt.grid(color = 'red', alpha=0.3, linestyle='--', linewidth=2)
plt.legend(loc='upper center', shadow=True, fontsize='x-large')

# 右下角,设置子图背景色为粉色
fig.add_subplot(2,2,4, facecolor='pink')
plt.plot(x, pow(x,2), 'k--', label='pow')
plt.legend(loc='upper center', shadow=True, fontsize='x-large')

# plt.ylabel('y',fontproperties=font_set)
# plt.title(u'混合图',fontproperties=font_set)
plt.show()


