Matplotlib用法使用、Matplotlib绘图作图画图
一、Matplotlib
Matplotlib:专门用于开发2D或3D图表,以渐进、交互式方式实现数据可视化
可视化是在整个数据挖掘的关键辅助工具,可以清晰的理解数据,从而调整我们的分析方法
- 能将数据进行可视化,更直观的呈现
- 使数据更加客观、更具说服力
二、图形绘制函数说明
安装命令
pip:pip install matplotlib
conda:conda install matplotlib- 导包:matplotlib.pytplot包含了一系列类似于matlab的画图函数
- 创建画布:plt.figure(figsize=(),dpi=),返回fig对象
- figsize:指定图的长宽
- dpi:图像的清晰度
- 绘制折线图:plt.plot(x, y)
- 自定义刻度
- x轴:plt.xticks(x, **kwargs),x为要显示的刻度值
- y轴:plt.yticks(y, **kwargs)
- 添加网格:plt.grid(True, linestyle='--', alpha=0.5),可更清楚观察图像对应值,alpha为网格粗细,范围0-1
- 描述信息
- x轴:plt.xlabel("x轴信息")
- y轴:plt.ylabel("y轴信息")
- 标题:plt.title("图像标题",fontsize='20'),fontsize为字体大小
- 显示图例:plt.legend(loc="best"),注:须在plt.plot()中设置一个label,若不设置,没法显示
- 多个坐标系显示
- plt.subplots(nrows=, ncols=)
- 保存:plt.savefig("路径") ,将图像保存到指定路径
- 显示图像:plt.show(),plt.show()会释放figure资源,如在显示图像之后保存图片将只能保存空图片
简单演示如下
import matplotlib.pyplot as plt
plt.figure(figsize=(5, 3), dpi=100)   # 创建画布
plt.plot([1, 2, 3, 4, 5, 6 ,7], [16,18,17,13,11,11,13])   # 绘制折线图
plt.show()   # 显示图像
三、图像添加辅助功能信息
import matplotlib.pyplot as plt
import random
# 中文显示问题
from pylab import mpl
mpl.rcParams["font.sans-serif"] = ["SimHei"]   # 设置显示中文字体
mpl.rcParams["axes.unicode_minus"] = False   # 设置正常显示符号

# 画出温度变化图
# 数据准备
x = range(0, 60)   # 随机生成[0, 50)范围内步长为1的整数列表
y = [random.uniform(13, 20) for i in x]   # random.uniform():随机生成13-20范围内的浮点数

plt.figure(figsize=(15, 5), dpi=80)   # 创建画布
plt.plot(x, y)   # 绘制折线图

x_ticks_label = ["20时{}分".format(i) for i in x]   # 构建x轴刻度标签
# y_ticks = range(40)   # 构建y轴刻度

# 修改x,y轴坐标的刻度显示
plt.xticks(x[::5], x_ticks_label[::5])
# plt.yticks(y_ticks[::1])

plt.grid(True, linestyle='--', alpha=0.5)   # 添加网格

# 描述信息
plt.xlabel("时间")
plt.ylabel("温度")
plt.title("20:00-21:00间温度变化图", fontsize=20)

plt.savefig("./zhangshu.jpg")  # 保存至指定位置
plt.show()  # 显示图像
输出如下
指定文件夹内新增图像文件
四、一个坐标系绘制多个图像
只需多次使用plot,其中color及linestyle可取值如下
| 颜色字符 | 风格字符 |
|---|---|
| r 红色 | - 实线 |
| g 绿色 | - - 虚线 |
| b 蓝色 | -. 点划线 |
| w 白色 | : 点虚线 |
| c 青色 | ' ' 留空、空格 |
| m 洋红 | |
| y 黄色 | |
| k 黑色 |
显示图例plt.legend(loc='best')或 plt.legend(loc=0),另需在plot中设置label,loc可取值如下
| 位置字符 | 位置代码 |
|---|---|
| 'best' | 0 |
| 'upper right' | 1 |
| 'upper left' | 2 |
| 'lower left' | 3 |
| 'lower right' | 4 |
| 'right' | 5 |
| 'center left' | 6 |
| 'center right' | 7 |
| 'lower center' | 8 |
| 'upper center' | 9 |
| 'center' | 10 |
举例如下
import matplotlib.pyplot as plt
import random

from pylab import mpl
mpl.rcParams["font.sans-serif"] = ["SimHei"]   # 设置显示中文字体
mpl.rcParams["axes.unicode_minus"] = False   # 设置正常显示符号

# 画出温度变化图
# 数据准备
x = range(0, 60)   # 随机生成[0, 50)范围内步长为1的整数列表
y = [random.uniform(13, 20) for i in x]   # random.uniform():随机生成13-20范围内的浮点数
yy = [random.uniform(5, 17) for i in x]   # random.uniform():随机生成13-20范围内的浮点数

plt.figure(figsize=(15, 5), dpi=80)   # 创建画布
plt.plot(x, y, color='y', linestyle='-.',label='赣州')   # 绘制折线图,点划线
plt.plot(x, yy, color='r', linestyle='--', label='樟树')   # 多次plot绘制多个折线图,虚线

x_ticks_label = ["20时{}分".format(i) for i in x]   # 构建x轴刻度标签
# y_ticks = range(40)   # 构建y轴刻度

# 修改x,y轴坐标的刻度显示
plt.xticks(x[::5], x_ticks_label[::5])
# plt.yticks(y_ticks[::1])

plt.grid(True, linestyle='-', alpha=0.9)   # 添加网格
plt.legend(loc=0)   # 显示图例

# 描述信息
plt.xlabel("时间")
plt.ylabel("温度")
plt.title("20:00-21:00间温度变化图", fontsize=18)

plt.savefig("./temperature.jpg")  # 保存至指定位置
plt.show()  # 显示图像
结果如下
五、多个坐标系绘制多个图像
通过subplots函数实现
- matplotlib.pyplot.subplots(nrows=1, ncols=1, **fig_kw):创建一个带有多个axes(坐标系/绘图区)的图
- nrows,ncols:设置有几行几列坐标系
- 返回图对象fig及相应数量的坐标系axes
- plt.函数名()相当于面向过程的画图方法,axes.set_方法名()相当于面向对象的画图方法
代码演示如下
# 数据准备
x = range(24)
y_zhshu = [random.uniform(5, 15) for i in x]
y_ganzh = [random.uniform(10, 20) for i in x]
fig, axes = plt.subplots(nrows=1, ncols=2, figsize=(15, 5), dpi=100)   # 创建画布

# 绘制图像
axes[0].plot(x, y_zhshu, color="g", linestyle=":",label="樟树")
axes[1].plot(x, y_ganzh, color="r", linestyle="-.", label="赣州")

# 构造x,y轴刻度标签
x_ticks_label = ["{}:00".format(i) for i in x]
# y_ticks = range(40)

# 刻度显示
axes[0].set_xticks(x[::2])
# axes[0].set_yticks(y_ticks[::5])
axes[0].set_xticklabels(x_ticks_label[::2])
axes[1].set_xticks(x[::2])
# axes[1].set_yticks(y_ticks[::5])
axes[1].set_xticklabels(x_ticks_label[::2])

# 添加网格显示
axes[0].grid(True, linestyle="--", alpha=0.2)
axes[1].grid(True, linestyle="-.", alpha=0.5)

# 添加描述信息
axes[0].set_xlabel("时间")
axes[0].set_ylabel("温度")
axes[0].set_title("24小时内樟树市温度变化图", fontsize=20)
axes[1].set_xlabel("时间")
axes[1].set_ylabel("温度")
axes[1].set_title("24小时内赣州市温度变化图", fontsize=14)

# 添加图例
axes[0].legend(loc=0)
axes[1].legend(loc=0)
plt.savefig("./subplots.jpg")   # 图像保存
plt.show()   # 图像显示
输出结果
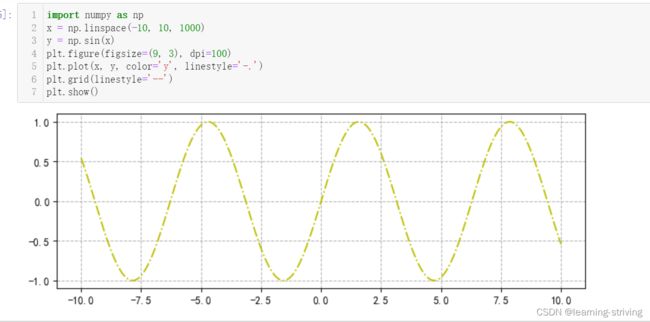
六、绘制数学函数图像
import numpy as np
x = np.linspace(-10, 10, 1000)
y = np.sin(x)
plt.figure(figsize=(9, 3), dpi=100)
plt.plot(x, y, color='y', linestyle='-.')
plt.grid(linestyle='--')
plt.show()
结果如下
matplotlib官网:https://matplotlib.org/stable/
学习导航:http://xqnav.top/


