matlab数字图像处理函数,MATLAB数字图像处理学习(二)|常用函数
以下的学习整理来自《数字图像处理原理与实践(MATLAB版)》
im2bw
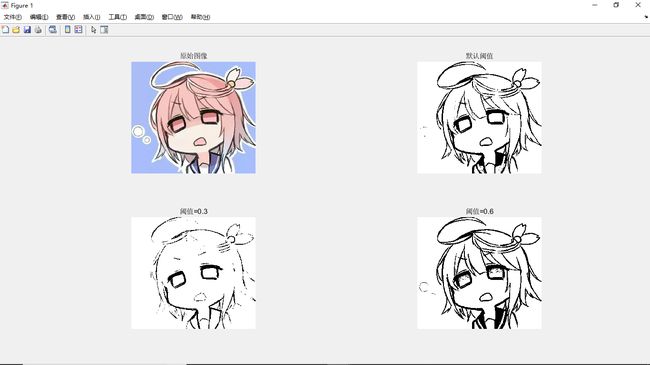
功能:将索引图象、灰度图像和RGB彩色图像转换为二值图像 调用形式: >BW = im2bw(I,level) BW = im2bw(X,cmap,level) BW = im2bw(RGB,level)
其中level用于设置阈值。level取值范围[0, 1]。 示例:
edge
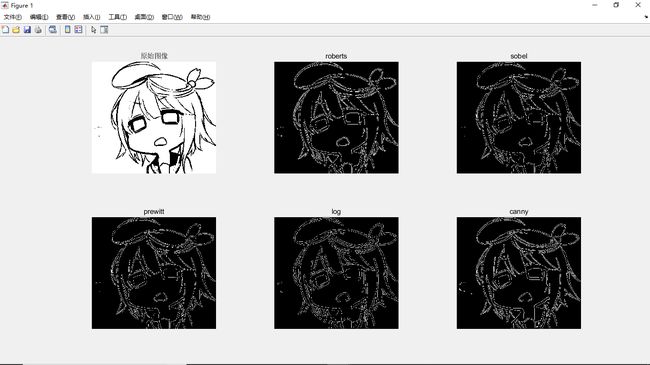
功能:功能是采用I作为它的输入,并返回一个与I相同大小的二值化图像BW,在函数检测到边缘的地方为1,其他地方为0。采用灰度或一个二值化图像I作为它的输入,并返回一个与I相同大小的二值化图像BW,在函数检测到边缘的地方为1,其他地方为0。
调用形式: >BW = edge(I) BW = edge(I,method) BW = edge(I,'sobel')%自动选择阈值用Sobel算子进行边缘检测。 BW = edge(I,method,threshold) BW = edge(I,method,threshold,direction) BW = edge(---,'nothinning') BW = edge(I,method,threshold,sigma) BW = edge(I,method,threshold,h) [BW,threshOut] = edge(---) [BW,threshOut,Gv,Gh] = edge(---)
示例: 1
2
3
4
5
6
7
8
9
10
11
12
13
14
15
16
17
18
19
20
21
22
23clear;
% 使用imread()函数读取图像
I1=imread('C:\Users\huayang\Desktop\MATLAB photo\测试.png');
I=im2bw(I1);
% 将索引彩色图象转换为灰度图像
bw1=edge(I,'roberts');
bw2=edge(I,'sobel');
bw3=edge(I,'prewitt');
bw4=edge(I,'log');
bw5=edge(I,'canny',[0.032,0.08],1);
figure
subplot(2,3,1),imshow(I);
title('原始图像');
subplot(2,3,2),imshow(bw1);
title('roberts');
subplot(2,3,3),imshow(bw2);
title('sobel');
subplot(2,3,4),imshow(bw3);
title('prewitt');
subplot(2,3,5),imshow(bw4);
title('log');
subplot(2,3,6),imshow(bw5);
title('canny');
strel
功能:构造结构元素(Structuring element)。所谓结构元素,可以看做是一张小图像,它通常用于图像的形态学运算(如膨胀、腐蚀、开运算、闭运算)。 调用形式: >SE = strel(shape, parameters)%根据shape指定的类型创建一个结构元素SE。 SE = strel('ball', R, H, N) SE = strel('diamond', R) SE = strel('disk', R, N) SE = strel('line', LEN, DEG) SE = strel('octagon', R) SE = strel('pair', OFFSET) SE = strel('periodicline', P, V) SE = strel('rectangle', MN) SE = strel('square', W)
示例: 见下一例。
imdilate与imerode
功能:可以使用imdilate函数进行图像膨胀;可以使用imerode函数进行图像腐蚀。 调用形式: >J = imdilate(I,SE) J = imdilate(I,nhood) J = imdilate(---,packopt) J = imdilate(---,shape) J = imerode(I,SE) J = imerode(I,nhood) J = imerode(---,packopt,m) J = imerode(---,shape)
示例: 1
2
3
4
5
6
7
8
9
10
11
12
13
14
15clear;
% 使用imread()函数读取图像
I1=imread('C:\Users\huayang\Desktop\MATLAB photo\测试.png');
I=im2bw(I1);
sel1=strel('disk',2);%创建一个指定半径1的平面圆盘形的结构元素
im1=imdilate(I,sel1);
im2=imerode(I,sel1);
subplot(2,2,1),imshow(I1);
title('彩色图像');
subplot(2,2,2),imshow(I);
title('原始图像');
subplot(2,2,3),imshow(im1);
title('图像膨胀');
subplot(2,2,4),imshow(im2);
title('图像腐蚀');
imfill
功能:该函数用于填充图像区域和“空洞”。 调用形式: >BW2 = imfill(BW) 这种格式将一张二值图像显示在屏幕上, 允许用户使用鼠标在图像上点几个点, 这几个点围成的区域即要填充的区域。要以这种交互方式操作, BW必须是一个二维的图像。用户可以通过按Backspace键或者Delete键来取消之前选择的区域;通过shift+鼠标左键单击或者鼠标右键单击或双击可以确定选择区域。 [BW2,locations] = imfill(BW) 这种方式, 将返回用户的取样点索引值。注意这里索引值不是选取样点的坐标。 BW2 = imfill(BW,locations) 这种格式允许用户编程时指定选取样点的索引。locations是个多维数组时, 数组每一行指定一个区域。 BW2 = imfill(BW,'holes') 填充二值图像中的空洞区域。 如, 黑色的背景上有个白色的圆圈。 则这个圆圈内区域将被填充。 I2 = imfill(I) 这种调用格式将填充灰度图像中所有的空洞区域。
示例: 1
2
3
4
5
6
7
8
9clear;
% 使用imread()函数读取图像
I1=imread('C:\Users\huayang\Desktop\MATLAB photo\测试.png');
I=im2bw(I1);
im3=imfill(I,'hole');
subplot(1,2,1),imshow(I);
title('原始图像');
subplot(1,2,2),imshow(im3);
title('图像填充');
bwareaopen
功能:删除二值图像BW中小面积对象,默认情况下使用8邻域。 调用形式: >BW2 = bwareaopen(BW,P) BW2 = bwareaopen(BW,P,conn)
示例: 1
2
3
4
5
6
7
8
9clear;
% 使用imread()函数读取图像
I1=imread('C:\Users\huayang\Desktop\MATLAB photo\测试.png');
I=im2bw(I1);
im1=bwareaopen(I,1200);
subplot(1,2,1),imshow(I);
title('原始图像');
subplot(1,2,2),imshow(im1);
title('删除对象');
关于matlab函数_连通区域得详解,可参考matlab函数bwareaopen的详解 关于matlab图像处理的更多知识,可参考形态学图像处理 最后,再奉上一个表情包用于测试:


