【数字图像处理】灰度变换与空间滤波
数字图像处理之灰度变换与空间滤波
- 一、灰度变换实验
- 二、幂律变换实验
- 三、直方图均衡化与自适应直方图均衡化实验
- 四、盒式核滤波实验
- 五、中值滤波实验
- 六、排序统计滤波器实验
- 七、锐化滤波实验
一、灰度变换实验
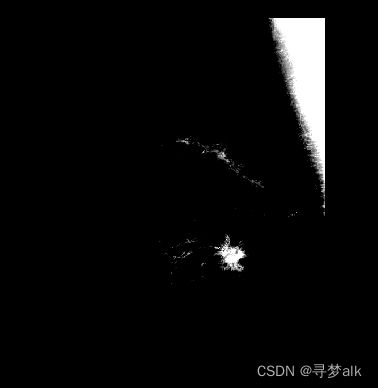
图中所示的是一幅数字乳房X射线图像,它显示了一处疾患。请用灰度变换imadjust进行实验:
(1) 请求出图1图像的明暗反转图像(负片图像)。
(2) 将图1图像0.5至0.75之间的灰度级扩展到范围[0, 1]。

(1)
clc;clear;close all;
old = imread("1.乳房X射线图像.tif");
imshow(old);title("原图像");

new1 = imadjust(old,[],[1 0]);
figure;imshow(new1);title("明暗翻转");
new2 = imadjust(old,[0.5 0.75],[0 1]);
figure;
imshow(new2);title("[0.5,0.75]扩展到[0,1]");
二、幂律变换实验
(1) 请对人体脊椎骨折的核磁共振图像进行幂律变换,取1,分别取0.6、0.4、0.3,对比分析结果。
(2) 请对所示的航拍图像进行幂律变换,取1,分别取3.0、4.0、5.0,对比分析实验结果。
clc;clear;close all;
old = imread("2.1人体脊椎骨折的核磁共振图像.tif");
subplot(221);imshow(old);title("initial image");
old = double(old);
gamma06 = im2uint8(mat2gray(old.^0.6));
subplot(222);imshow(gamma06);title("\gamma=0.6");
gamma04 = im2uint8(mat2gray(old.^0.4));
subplot(223);imshow(gamma04);title("\gamma=0.4");
gamma03 = im2uint8(mat2gray(old.^0.3));
subplot(224);imshow(gamma03);title("\gamma=0.3");
clc;clear;close all;
old = imread("2.2航拍图像.tif");
subplot(221);imshow(old);title("initial image");
old = double(old);
gamma3 = im2uint8(mat2gray(old.^3));
subplot(222);imshow(gamma3);title("\gamma=3");
gamma4 = im2uint8(mat2gray(old.^4));
subplot(223);imshow(gamma4);title("\gamma=4");
gamma5 = im2uint8(mat2gray(old.^5));
subplot(224);imshow(gamma5);title("\gamma=5");

实验结果分析:

根据曲线可以看出在γ<1时,会使整体的灰度值映射为更大的值,也就是使图像看起来更加明亮,图像的对比度和可分辨细节在γ值适中时更加合适,如果很小,会导致图像过于苍白,对比度降低;在γ>1时,会使整体的灰度值映射为更小的值,也就是使图像看起来比之前更暗,图像中的部分内容会随之变得更加清晰。
三、直方图均衡化与自适应直方图均衡化实验
分别4种基本图像的直方图,并用函数histeq对这4种基本图像进行直方图均衡,分析实验结果。

clc;clear;close all;
dark = imread("3.1暗图像.tif");
bright = imread("3.2亮图像.tif");
low = imread("3.3低对比度图像.tif");
high = imread("3.4高对比度图像.tif");
subplot(221);imhist(dark);title("dark");
subplot(222);imhist(bright);title("bright");
subplot(223);imhist(low);title("low");
subplot(224);imhist(high);title("high");

dark_result = histeq(dark,256);
bright_result = histeq(bright,256);
low_result = histeq(low,256);
high_result = histeq(high,256);
figure;
subplot(221);imshow(dark_result);title("dark-result");
subplot(222);imshow(bright_result);title("bright-result");
subplot(223);imshow(low_result);title("low-result");
subplot(224);imshow(high_result);title("high-result");

figure;
subplot(221);imhist(dark_result);title("dark-result");
subplot(222);imhist(bright_result);title("bright-result");
subplot(223);imhist(low_result);title("low-result");
subplot(224);imhist(high_result);title("high-result");


实验结果分析:
通过直方图可以看出,如果均衡化之前直方图显示出每个图片的灰度级只是分布在某一区域内,均衡化后会覆盖到整个灰度级,这使得图像的亮区域和暗区域的灰度差别更大,对比度更强,由此图像中的各部分内容看起来更加清晰。
四、盒式核滤波实验
图中所示的是大小为1024×1024像素的测试模式。请使用大小分别为3×3, 11×11和21×21的盒式核对图5所示的图像进行低通滤波,分析比较实验结果。

clc;clear;close all;
image = imread("4.1024×1024像素的测试模式.tif");
subplot(221);imshow(image);title("initial image");
w1 = ones(3,3)/(3^2);
w2 = ones(11,11)/(11^2);
w3 = ones(21,21)/(21^2);
t1 = imfilter(image,w1);
t2 = imfilter(image,w2);
t3 = imfilter(image,w3);
subplot(222);imshow(t1);title("3*3");
subplot(223);imshow(t2);title("11*11");
subplot(224);imshow(t3);title("21*21");

实验结果分析:
通过对比可以看出选择的盒式滤波器核的大小越大,会导致图像的模糊程度越大,这是因为盒式滤波器核的大小会决定输出图像各点像素受到原图像影响的范围大小,滤波器核越大,则原图像中较大范围的像素值会决定输出像素的值,反之,则输出像素值受到影响的范围较小,也就是处理得更加精细,所以看起来相对清晰;同时值得注意的是,输出图像会有灰色边框出现,这是由于滤波前图像零填充的结果,因为边缘零值得存在,使得边缘处的像素值更低。
五、中值滤波实验
图中显示了一幅被椒盐噪声污染的电路板的X射线图像。
(1) 请使用19×19、标准差为3的高斯低通滤波器处理噪声图像。
(2) 请使用7×7大小的中值滤波器处理噪声图像。
(3) 比较以上两种滤波器对含椒盐噪声图像的滤波效果。

clc;clear;close all;
image = imread("5.被椒盐噪声污染的电路板的X射线图像.tif");
imshow(image);title("initial image");
w = fspecial('gaussian', [19 19], 3);
image_gaussian = imfilter(image, w);
figure;imshow(image_gaussian);title("by gaussian filter");
image_med = medfilt2(image, [7 7]);
subplot(133);imshow(image_med);title("by median filter");

实验结果分析:
对比后可以发现,中值滤波器核的效果相对于高斯滤波器核的效果更好,这是因为,高斯滤波器核与原图像作用后的各点输出结果会受到原图像像素核大小范围内的所有像素值的影响,椒盐噪声的存在会使输出值与原本的输出值产生偏差,表现为使图像模糊;而中值滤波器核的各点输出结果是选择原图像像素核大小范围内的中值,而椒盐噪声的值处于两个极端值,显然对中值的选择不会产生很大的影响,所以效果较好。
六、排序统计滤波器实验
用imnoise函数给所示的X射线图像叠加椒盐噪声,噪声密度为0.02。将排序统计滤波函数ordfilt2分别设置为最小值滤波、最大值滤波和中值滤波,邻域大小为3×3,对含有椒盐噪声的图像进行滤波。

clc;clear;close all;
image = imread("6.X射线图像.tif");
noised = imnoise(image,'salt & pepper',0.02);
min_filter = ordfilt2(noised,1,ones(3,3));
max_filter = ordfilt2(noised,9,ones(3,3));
med_filter = ordfilt2(noised,5,ones(3,3));
subplot(221);imshow(noised);title("椒盐噪声图像");
subplot(222);imshow(min_filter);title("最小值滤波");
subplot(223);imshow(max_filter);title("最大值滤波");
subplot(224);imshow(med_filter);title("中值滤波");
七、锐化滤波实验
所示的是月球北极的一幅略显模糊的图像。

(1) 使用所示的中心为-4的拉普拉斯核,结合imfilter函数进行拉普拉斯滤波。
(2) 先用im2double函数将所示的图像转换为double类,然后使用所示的核对其进行拉普拉斯滤波。(由于使用imfilter滤波后的输出图像和输入图像是同类图像,所以图像经拉普拉斯滤波后的负值会被截掉,我们通过在滤波前将图像转换成double类图像可解决这一问题。)

(3) 根据 g ( x , y ) = f ( x , y ) + c [ ∇ 2 f ( x , y ) ] g(x,y)=f(x,y)+c[\nabla^2f(x,y)] g(x,y)=f(x,y)+c[∇2f(x,y)],求使用上面所示的核锐化后的图像。
(4) 求使用下面所示的中心为-8的拉普拉斯核锐化后的图像。

注意:
当拉普拉斯核中心系数为负值时,应取值为-1,否则取值为1;
(1)
clc;clear;close all;
image = imread("7.月球北极的模糊图像.tif");
L_filter = [0 1 0;1 -4 1;0 1 0];
image_L_uint8 = imfilter(image,L_filter);
imshow(image_L_uint8);title("image-L-uint8");
image_double = im2double(image);
image_L_double = imfilter(image_double,L_filter);
% image_L_double = func_normalize(image_L_double, 255);
figure;
imshow(image_L_double,[]);title("image-L-double");

function image_normalized = func_normalize(image, range)
image = double(image);
%将图像标定到[0,range]的范围内
MIN = min(min(image));

subtract = image - MIN;
max_subtract = max(max(subtract));

image_normalized = range*(subtract/max_subtract);
if range == 255
    image_normalized = uint8(image_normalized);
end
function image_normalized = func_normalize(image, range)
image = double(image);
%将图像标定到[0,range]的范围内
MIN = min(min(image));

subtract = image - MIN;
max_subtract = max(max(subtract));

image_normalized = range*(subtract/max_subtract);
if range == 255
    image_normalized = uint8(image_normalized);
end
(3)
clc;clear;close all;
image = imread("7.月球北极的模糊图像.tif");
L1 = [0 1 0;1 -4 1;0 1 0];
sharpen_image1 = func_L_sharpen(image, L1, -1);
imshow(sharpen_image1);title("中心为-4");
function sharpen_image = func_L_sharpen(image, L, c)
d = im2double(image);
[x,y] = size(d);
s = zeros((x+2),(y+2));
s(2:(x+1),2:(y+1)) = d;
sharpen_image = zeros(x,y);
for i = 2:(x+1)
    for j = 2:(y+1)
        Lap = L(1,1)*s(i-1,j-1)     +L(1,2)*s(i-1,j)    +L(1,3)*s(i-1,j+1)+...
              L(2,1)*s(i,j-1)       +L(2,2)*s(i,j)      +L(2,3)*s(i,j+1)+...
              L(3,1)*s(i+1,j-1)     +L(3,2)*s(i+1,j)    +L(3,3)*s(i+1,j+1);
        sharpen_image(i-1,j-1) = s(i,j)+c*Lap;
    end
end
(4)
L2 = [1 1 1;1 -8 1;1 1 1];
sharpen_image2 = func_L_sharpen(image, L2, -1);
figure;imshow(sharpen_image2);title("中心为-8");


