吴恩达机器学习ex4代码
import numpy as np
import matplotlib.pyplot as plt
import scipy.io as sio
from scipy.io import loadmat
import scipy.optimize as opt
from sklearn.metrics import classification_report

'''========================================函数部分========================================'''
'''数据图像化'''
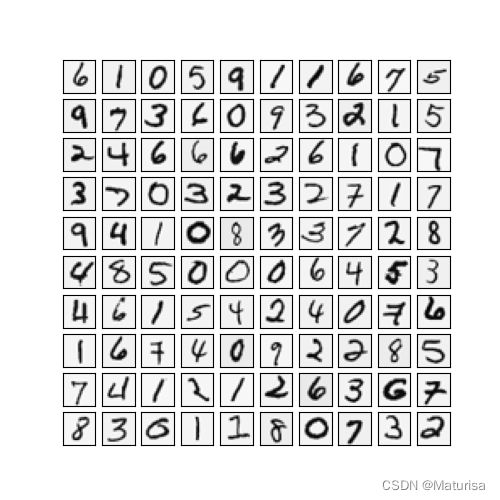
def mat2img(X):
    sample_index = np.random.choice(len(X),100)
    images = X[sample_index,:]
    # print('image_shape:',images.shape)   #100*400
    fig,ax = plt.subplots(ncols=10,nrows=10,figsize=(5,5),sharex=True,sharey=True)
    plt.xticks([])
    plt.yticks([])
    for r in range(10):
        for c in range(10):
            ax[r,c].imshow(images[10*r+c,:].reshape(20,20).T,cmap='gray_r')   #reshape是将像素点数据重新转换为像素点
    plt.show()


'''参数拍平'''
def flatten_connect(t1,t2):
    return np.concatenate((t1.flatten(),t2.flatten()))   #先拍平,再连起来。等同于 np.r_[t1.flatten(),t2.flatten()]


'''参数复原'''
def reshape(seq):
    t1 = seq[:25*401].reshape(25,401)
    t2 = seq[25*401:].reshape(10,26)
    return t1, t2


'''前向传播函数'''
def feed_forward(theta,X):
    Theta1, Theta2 = reshape(theta)
    a1 = X
    z2 = a1 @ Theta1.T
    a2 = sigmoid(z2)
    a2 = np.insert(a2,0,1,axis=1)
    z3 = a2 @ Theta2.T
    a3 = sigmoid(z3)
    return a1,z2,a2,z3,a3


'''激活函数'''
def sigmoid(z):
    return 1 / (1 + np.exp(-z))


'''代价函数(带正则)'''
def costReg(theta,X,y,lbd):
    a1, z2, a2, z3, h = feed_forward(theta,X)   #h即a3,预测值
    # print('h:',h)  #h是推测的具体的数,不是概率
    # print(h.shape)   #5000*10
    J = 0
    for i in range(X.shape[0]):   #range(5000)
        ans=np.multiply(-y[i],np.log(h[i]))-np.multiply((1-y[i]),np.log(1-h[i]))   #每个样本的cost分别求,再加起来
        sum = np.sum(ans)
        J += sum
    Theta1, Theta2 = reshape(theta)
    J = J/(X.shape[0]) + lbd / (2 * X.shape[0]) * (np.sum(np.power(Theta1[:, 1:], 2)) + np.sum(np.power(Theta2[:, 1:], 2)))   #注意正则不要带theta1和theta2的首项
    return J


'''随机初始化'''
def random_init(size):
    return np.random.uniform(-0.12,0.12,size)  #随机生成指定范围的浮点数,从一个均匀分布[low,high)中随机采样,定义域是左闭右开,ndarray类型,其形状与size中描述一致.


'''反向传播求梯度gradient(不带正则)'''
def Gradient(theta, X, y):
    a1, z2, a2, z3, h = feed_forward(theta,X)   #h即a3,预测值
    Theta1, Theta2 = reshape(theta)
    d3 = h - y  #5000*10
    d2 = np.multiply( d3 @ Theta2[:, 1:], (sigmoid(z2)*(1-sigmoid(z2))) )  #5000*25。尤其注意矩阵乘法和对位相乘的区别!
    D2 = d3.T @ a2  #10*26
    D1 = d2.T @ a1  #25*401
    return D1, D2


'''反向传播求梯度gradient(带正则)'''
def Regularized_gradient(theta,X,y,lbd):
    a1, z2, a2, z3, h = feed_forward(theta,X)
    D1, D2 = Gradient(theta, X, y)
    Theta1, Theta2 = reshape(theta)
    Theta1[:,0]=0   #当j=0时,不惩罚,所以干脆将第一列变成0
    Theta2[:,0]=0
    reg_D1=D1+(lbd/X.shape[0])*Theta1
    reg_D2=D2+(lbd/X.shape[0])*Theta2
    return np.concatenate((reg_D1.flatten(),reg_D2.flatten()))


'''梯度检测,正式运行时全部忽略'''
# def Gradient_checking(theta,X,y):
#     numgrad = np.zeros(theta.shape)   #(10280,)
#     perturb = np.zeros(theta.shape)   #(10280,)
#     e = 1e-4
#     for i in range(len(theta)):
#         perturb[i] = e
#         left = cost_alternative(theta + perturb,X,y,1)
#         right = cost_alternative(theta - perturb,X,y,1)
#         #计算数值梯度
#         numgrad[i] = (left - right) / (2*e)
#         perturb[i] = 0
#     return numgrad


'''准确度'''
def accuracy(theta,X,y):
    a1, z2, a2, z3, h = feed_forward(theta, X)
    y_predict = np.argmax(h, axis=1) + 1
    accuracy = classification_report(y, y_predict)
    return accuracy


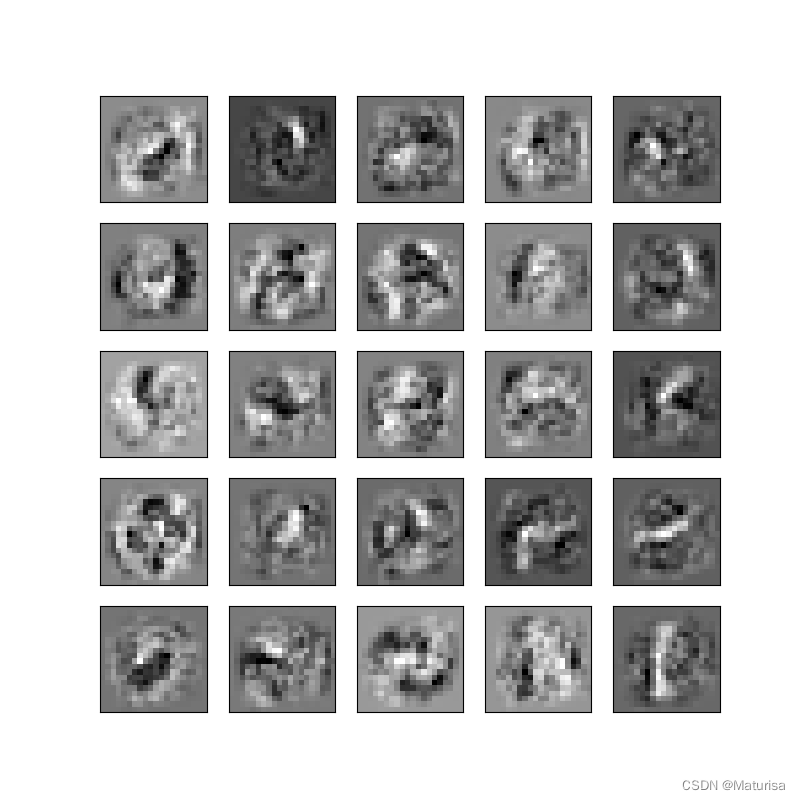
def plot_hidden(theta):
    Theta1,Theta2=reshape(theta)
    Theta1=Theta1[:,1:]   #去掉偏置项的theta
    fix,ax_array=plt.subplots(nrows=5,ncols=5,sharex=True,sharey=True,figsize=(8,8))
    for r in range(5):   #这里的5和下面的5,是因为隐藏层里一共有25个神经元(去掉一个偏置项)
        for c in range(5):
            ax_array[r,c].matshow(Theta1[r*5+c].reshape(20,20),cmap='gray_r')
            plt.xticks([])
            plt.yticks([])
    plt.show()


'''========================================计算部分========================================'''
'''导入数据X,y'''
data = loadmat('D:\新大陆\吴恩达机器学习\ex4\ex4data1.mat')
# print(data)
# print(type(data))   #类型是字典
X = data['X']
y = data['y']
# print(X)
print('X_shape:',X.shape)   #array 5000*400,还没有加X0
# print(y)
print('y_shape:',y.shape)   #array 5000*1


''' 数据图像化'''
mat2img(X)


'''导入θ'''
weight = loadmat('D:\新大陆\吴恩达机器学习\ex4\ex4weights.mat')
# print(weight)
Theta1 = weight['Theta1']
Theta2 = weight['Theta2']
print('Theta1_shape:',Theta1.shape)   #25*401,已经加了偏置神经元
print('Theta2_shape:',Theta2.shape)   #10*26,已经加了偏置神经元
# print('Theta1',Theta1)


'''X数据处理:插入X0'''
X = np.insert(X,0,values=np.ones(X.shape[0]),axis=1)
print('new_X_shape:',X.shape)   #5000*401


'''y数据处理:拍平,扩展'''
y = y.flatten()   #(5000,),type是list,拍平之前是array
result = []
for it in y:   #这种写法指的是y作为一个list,其中每一个数的数值
    y_array = np.zeros(10)
    y_array[it - 1] = 1
    result.append(y_array)   #直到这里为止,result都是list
y = np.array(result)
print('new_y_shape:',y.shape)   #5000*10


'''算代价cost'''
theta = flatten_connect(Theta1,Theta2)
print('regularized original cost:',costReg(theta,X,y,1))


'''================================================梯度检测,正式运行时全部关闭=============================================='''
'''梯度检测'''
# print(Gradient_checking(theta,X,y))

'''
结果1(代价函数正则,梯度下降不正则)
numgrad = [ 6.18712742e-05 -1.94289029e-12  5.55111512e-13 ...  4.70513167e-05  -5.01718606e-04  5.07825786e-04]
 '''
'''====================================================================================================================='''


'''优化参数theta'''
theta_init = random_init(10285)
min = opt.minimize(fun=costReg, x0=theta, args=(X, y, 1), method='TNC', jac=Regularized_gradient)
print(min)


'''计算准确度'''
theta = min.x   #优化后的theta
y = data['y']
print('accuracy:',accuracy(theta,X,y))   #X(5000,401),y(5000,1),theta(10285,)


'''显示隐藏层'''
plot_hidden(theta)


'''
当lbd = 0.1时
fun: 0.11077798874560327   现在的代价
     jac: array([-2.53133449e+00, -2.11247519e-13,  4.38827691e-14, ...,
       -1.18178528e-01, -1.34341584e+00,  7.39197308e-01])
 message: 'Converged (|f_n-f_(n-1)| ~= 0)'
    nfev: 174
     nit: 6
  status: 1
 success: True
       x: array([-5.39307423e-02, -1.05623759e-08,  2.19413846e-09, ...,
       -2.95529819e-01,  3.38539600e+00, -2.61742190e+00])
accuracy:               precision    recall  f1-score   support

           1       0.99      1.00      1.00       500
           2       0.99      1.00      1.00       500
           3       1.00      0.99      1.00       500
           4       1.00      1.00      1.00       500
           5       1.00      1.00      1.00       500
           6       1.00      1.00      1.00       500
           7       1.00      0.99      0.99       500
           8       1.00      1.00      1.00       500
           9       1.00      0.99      0.99       500
          10       1.00      1.00      1.00       500

    accuracy                           1.00      5000
   macro avg       1.00      1.00      1.00      5000
weighted avg       1.00      1.00      1.00      5000
要注意,这里的学习率是0.1,也就是不怎么惩罚,所以这个很高的准确度是过拟合的结果,对新的样本,准确率将大大降低(我们是将所有5000个样本都用上了的,相当于没有验证集。这里的高准确度也只是针对这5000个样本)。
'''
X_shape: (5000, 400)
y_shape: (5000, 1)
Theta1_shape: (25, 401)
Theta2_shape: (10, 26)
new_X_shape: (5000, 401)
new_y_shape: (5000, 10)
regularized original cost: 0.38376985909092354
     fun: 0.3504970874968651
     jac: array([ 6.28581456e-01, -2.11247727e-12,  4.38828123e-13, ...,
       -8.25089493e-01, -4.03046149e+00,  2.34724368e+00])
 message: 'Converged (|f_n-f_(n-1)| ~= 0)'
    nfev: 661
     nit: 18
  status: 1
 success: True
       x: array([-2.70981783e-02, -1.05623863e-08,  2.19414062e-09, ...,
       -2.52479302e-01,  1.47852395e+00, -1.47648711e+00])
accuracy:               precision    recall  f1-score   support

           1       0.97      0.98      0.98       500
           2       0.98      0.98      0.98       500
           3       0.98      0.97      0.97       500
           4       0.97      0.97      0.97       500
           5       0.98      0.99      0.99       500
           6       0.99      0.99      0.99       500
           7       0.98      0.97      0.98       500
           8       0.98      0.99      0.98       500
           9       0.97      0.97      0.97       500
          10       0.99      0.99      0.99       500

    accuracy                           0.98      5000
   macro avg       0.98      0.98      0.98      5000
weighted avg       0.98      0.98      0.98      5000
数据图像化(抽样100个):
隐藏层图像化:
部分代码参考大佬:Phoenix_ZengHao。感谢所有在机器学习路上的引路人。

