matplotlib画图的常用技巧
matplotlib的使用
- 1.使用matplotlib.pyplot将几个子图画在一幅图中
-
- 1.1 matplotlib.pyplot(plt)程序
- 1.2 结果
- 2.设置plt图中x,y坐标单位长度相同
- 3.不显示坐标轴、刻度、边框
- 4.一定时间后自动关闭plot画面
- 5.matplotlib画3D图
- 6. 显示legend
- 7. 画boxplot
- 8.常用资料
-
- 8.1 Matplotlib rcParams
-
- 8.1.1 画图中设置title的中文支持
- 8.1.2 font.family
- 8.2 matplotlib.markers
-
- 8.2 .1 画出空心marker
- 8.3 matplotlib颜色大全[^3]
- 参考文献
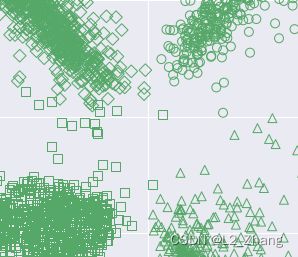
1.使用matplotlib.pyplot将几个子图画在一幅图中
1.1 matplotlib.pyplot(plt)程序
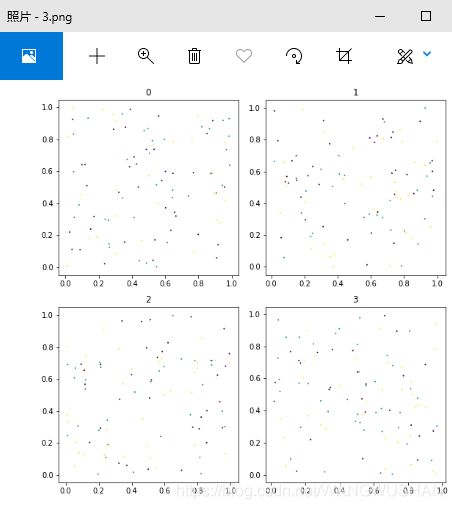
各二维子图的值均为np.random.random产生的随机数。
import numpy as np
import matplotlib.pyplot as plt
import os
fig, axs = plt.subplots(nrows=2, ncols=2, figsize=(8, 8))

for i in range(2):
    for j in range(2):
        axs[i, j].scatter(np.random.random((100)), np.random.random((100)),c=np.random.randint(1,4,(100)),s=1)
        axs[i, j].set_title(str(i*2+j))

plt.tight_layout()
plt.savefig( "D:\\"+str(i*2+j))
plt.show()
1.2 结果
在D:\下生成图片3.png,其由4个子图组成,sub_title分别为0~3。
2.设置plt图中x,y坐标单位长度相同
plt.gca().set_aspect(‘equal’)
示例:

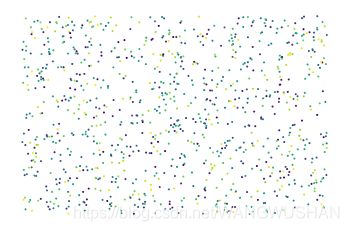
3.不显示坐标轴、刻度、边框
import  matplotlib.pyplot  as plt
from matplotlib.ticker import NullLocator
import numpy as np

x=np.random.random((1000,2))
y=np.random.randint(0,255,(1000,))
plt.scatter(x[:,0],x[:,1],s=1,c=y)

plt.axis("off")
plt.gca().xaxis.set_major_locator(NullLocator())
plt.gca().yaxis.set_major_locator(NullLocator())
plt.show()
效果如下:
4.一定时间后自动关闭plot画面
plt.ion()
plt.plot(***)
# plt.show()
plt.savefig(f'{pic_name}.jpg')
plt.pause(2)       # 显示秒数
plt.close()
5.matplotlib画3D图
三维图matlab是真心好用,即使用surf()。
而目前matplotlib相对没有那么简单。
下面这个例子以z为x,y平方和的均值,画出对应的三维图。
import numpy as np
import matplotlib.pyplot as plt

def f(x, y):
 return np.sqrt(x ** 2 + y ** 2)
x = np.linspace(-6,6,30)
y = np.linspace(-6,6,30)
X, Y = np.meshgrid(x, y)
Z = f(X,Y)

fig = plt.figure()
ax = plt.axes(projection='3d')
ax.contour3D(X, Y, Z, 50)
ax.set_xlabel('x')
ax.set_ylabel('y')
ax.set_zlabel('z')
ax.view_init(20, 35)
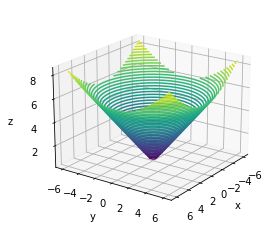
图还是不错的,就是视角根据需要调整。
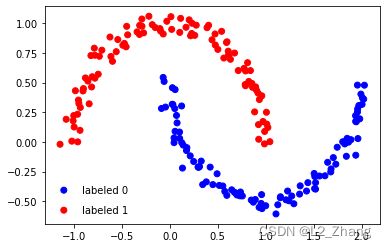
6. 显示legend
import matplotlib.pyplot as plt
import numpy as np
from sklearn import datasets

np.random.seed(123)
n_samples = 200
noisy_moons = datasets.make_moons(n_samples=n_samples, noise=0.05)
features = noisy_moons[0]
labels = noisy_moons[1]

c_s = ['r', 'b', 'darkgrey']

mk = ["^", "o"]
markers = np.array([mk[item] for item in labels])
colors = np.array([c_s[item] for item in labels])

plt.scatter(features[labels == 1][:, 0], features[labels == 1]
            [:, 1], c=colors[labels == 1], marker="o", label="labeled 0")
plt.scatter(features[labels == 0][:, 0], features[labels == 0]
            [:, 1], c=colors[labels == 0], marker="o", label="labeled 1")

plt.legend(scatterpoints=1, frameon=False,
           labelspacing=1, loc='lower left')
plt.show()
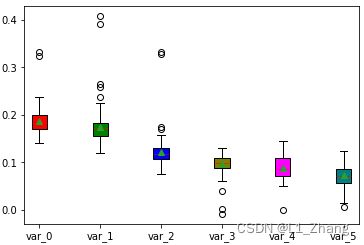
7. 画boxplot
设data维度为num*6,画出6个box图:
fig, ax = plt.subplots()
labels=[item.split('.')[0] for item in file_names]
VP = ax.boxplot(data, positions=[2, 4, 6, 8, 10, 12],
                patch_artist=True,
                vert=True,
                showmeans=True, showfliers=True,
                medianprops={"color": "red", "linewidth": 0.5},
                labels=labels
                )
for box, c in zip(VP['boxes'], colors):
    box.set(facecolor=c)
plt.show()
8.常用资料
8.1 Matplotlib rcParams
8.1.1 画图中设置title的中文支持
在使用Matplotlib.pyplot画图过程中,有时需要设置中文标题,如:
axs[0].set_title(u"标题1")。
这时候标题的位置会默认显示“□□□”。
为了将中文字体显示出来,需要进行一些设置:
plt.rcParams['font.sans-serif'] = ['KaiTi']
plt.rcParams['font.serif'] = ['KaiTi']
这里的’KaiTi’,即设置为楷体字体。参考CSS 中文字体的英文名称1:
华文细黑:STHeiti Light [STXihei]
华文黑体:STHeiti
华文楷体:STKaiti
华文宋体:STSong
华文仿宋:STFangsong
俪黑 Pro:LiHei Pro Medium
俪宋 Pro:LiSong Pro Light
标楷体:BiauKai
苹果俪中黑:Apple LiGothic Medium
苹果俪细宋:Apple LiSung Light

Windows的一些:

新细明体:PMingLiU
细明体:MingLiU
标楷体:DFKai-SB
黑体:SimHei
宋体:SimSun
新宋体:NSimSun
仿宋:FangSong
楷体:KaiTi
仿宋_GB2312:FangSong_GB2312
楷体_GB2312:KaiTi_GB2312
微软正黑体:Microsoft JhengHei
微软雅黑体:Microsoft YaHei

装Office会生出来的一些:

隶书:LiSu
幼圆:YouYuan
华文细黑:STXihei
华文楷体:STKaiti
华文宋体:STSong
华文中宋:STZhongsong
华文仿宋:STFangsong
方正舒体:FZShuTi
方正姚体:FZYaoti
华文彩云:STCaiyun
华文琥珀:STHupo
华文隶书:STLiti
华文行楷:STXingkai
华文新魏:STXinwei


如果显示中文标题后,数字中“-“号无法显示,可以设置:
```python
matplotlib.rcParams['axes.unicode_minus'] =False
8.1.2 font.family
Matplotlib 的font具有以下五个属性:
- ‘serif’ (e.g., Times),
- ‘sans-serif’ (e.g., Helvetica),
- ‘cursive’ (e.g., Zapf-Chancery),
- ‘fantasy’ (e.g., Western), and
- ‘monospace’ (e.g., Courier).
那么分别代表什么意思呢,可参考2:
※Serif:在字的笔划开始及结束的地方有额外的装饰,而且笔划的粗细会因直横的不同而有不同。
※Sans Serif则没有这些额外的装饰。
如:
※Monospace:等宽字体
※Cursive书写体:相当于印刷学中的手写体。中文的华文行草就是这样的一个字体。

8.2 matplotlib.markers
此内容见matplotlib.markers。

8.2 .1 画出空心marker
设置edgecolors,同时将color设为空,即为空心marker:
markers=["o","s","D","^"]
for i in range(4):
    plt.scatter(X_reduced[colrs==i, 0], X_reduced[colrs==i, 1],
                 marker=markers[i],s=80, color='',edgecolors='g')
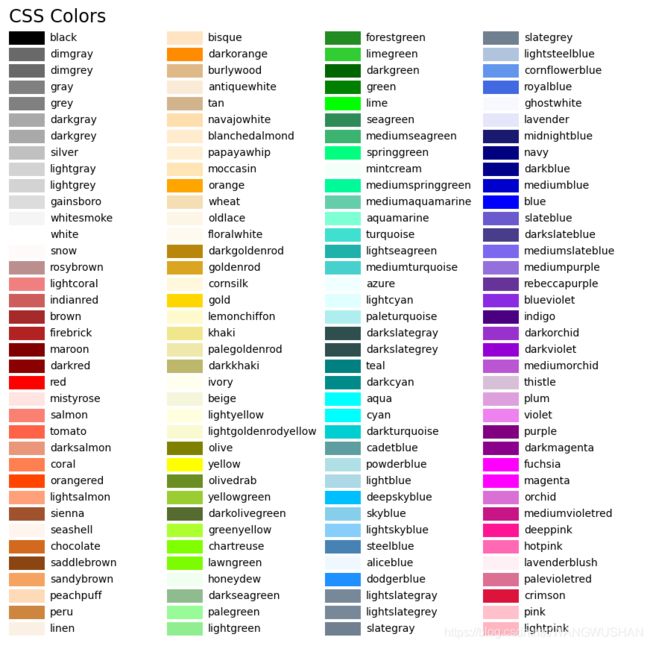
8.3 matplotlib颜色大全3
参考文献
[1] https://matplotlib.org/gallery/lines_bars_and_markers/scatter_star_poly.html#sphx-glr-gallery-lines-bars-and-markers-scatter-star-poly-py
[2] 如何用Matplotlib 画三维图的示例代码
[3] Matplotlib boxplot
https://www.cnblogs.com/ssrsblogs/p/6065403.html ↩︎
Serif和Sans-serif字体的区别 ↩︎
https://matplotlib.org/gallery/color/named_colors.html#sphx-glr-gallery-color-named-colors-py ↩︎