Python mpl_toolkits.mplot3d工具包绘制三维图
在Python中我们可以导入mplot3d工具包来绘制三维图。
在
Matplotlib 1.0.0之前,每个图形只能创建一个Axes3D,需要被直接定义为ax = Axes3D
在
Matplotlib 3.2.0之前,必须导入mpl_toolkits.mplot3d模块将关键字Projection='3d'传递给Figure.add_subplot
3维坐标系通过将关键字Projection='3d'传递给Figure.add_subplot创建,无需导入mpl_toolkit.mplot3d就可以实现三维图的绘制。
import matplotlib.pyplot as plt
fig = plt.figure()
ax = fig.add_subplot(projection='3d')
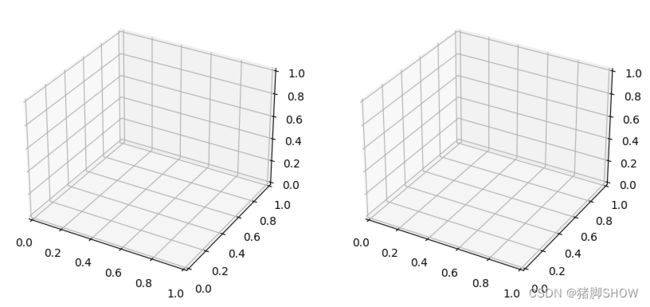
也可以在同一个画布中
fig中创建多个3D子图,就像2D子图一样。
import numpy as np
import matplotlib.pyplot as plt

fig = plt.figure(figsize = (10,8))
ax1 = fig.add_subplot(121, projection='3d')
ax2 = fig.add_subplot(122,projection = '3d')

plt.show()
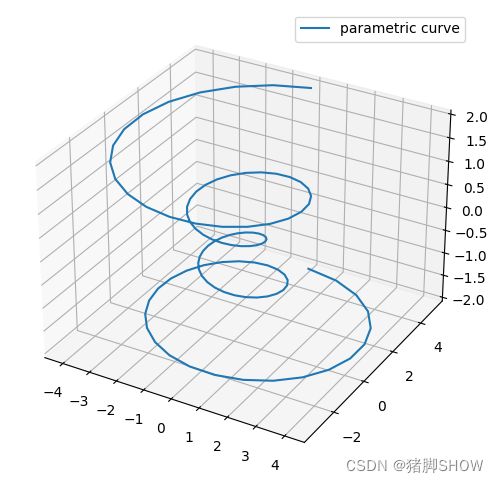
曲线图
import numpy as np
import matplotlib.pyplot as plt

fig = plt.figure(figsize=[8,6])
ax = fig.add_subplot(projection='3d')

# Prepare arrays x, y, z
theta = np.linspace(-4 * np.pi, 4 * np.pi, 100)
z = np.linspace(-2, 2, 100)
r = z**2 + 1
x = r * np.sin(theta)
y = r * np.cos(theta)

ax.plot(x, y, z, label = "parametric curve")
ax.legend()
plt.show()
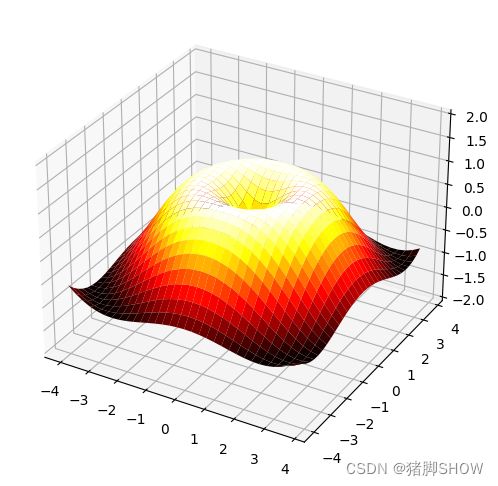
曲面图
import numpy as np
import matplotlib.pyplot as plt

fig = plt.figure(figsize=[8,6])
ax = fig.add_subplot(projection='3d')
X = np.arange(-4, 4, 0.25)
Y = np.arange(-4, 4, 0.25)
X, Y = np.meshgrid(X, Y)
R = np.sqrt(X**2 + Y**2)
Z = np.sin(R)

ax.plot_surface(X, Y, Z, rstride=1, cstride=1, cmap=plt.cm.hot)
# ax.contourf(X, Y, Z, zdir='z', offset=-2, cmap=plt.cm.hot)
ax.set_zlim(-2,2)

plt.show()
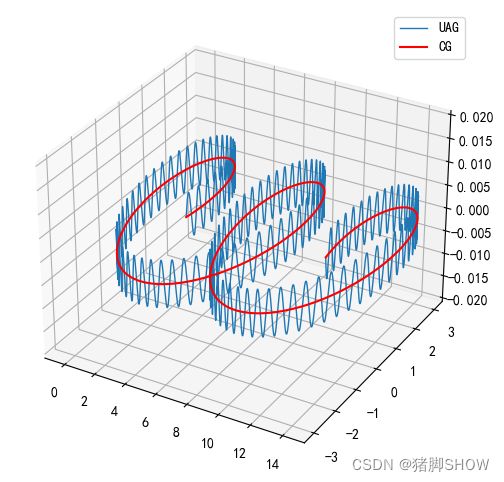
两条曲线
import numpy as np
import matplotlib.pyplot as plt

plt.rcParams['axes.unicode_minus']=False
plt.rcParams['font.sans-serif'] = ['SimHei']

fig = plt.figure(figsize=(8,6))
ax1 = fig.add_subplot(projection='3d')

# Prepare arrays x, y, z
t = np.linspace(0, 3, 10000)
x = 5*t + 3 * np.cos((np.pi*50*t)/30)
y = 3 * np.sin((np.pi*50*t)/30)
z = 0.005 * np.sin(2*np.pi*40*t)

x1 = 5*t + 3 * np.cos((np.pi*50*t)/30)
y1 = 3 * np.sin((np.pi*50*t)/30)
z1 = 0

ax1.plot(x, y, z,linewidth = 1)
ax1.plot(x1,y1,z1,c='r')
ax1.legend(["UAG","CG"])
ax1.set_zlim(-0.02,0.02)
ax1.set_xlim(-1,15)


x1 = 5*t + 3 * np.cos((np.pi*50*t)/30)
y1 = 3 * np.sin((np.pi*50*t)/30)

plt.show()


