26-Vue之ECharts-柱状图
ECharts-柱状图
-
-
- 前言
- 柱状图实现步骤
- 柱状图常见效果
-
- 标记
- 显示
-
前言
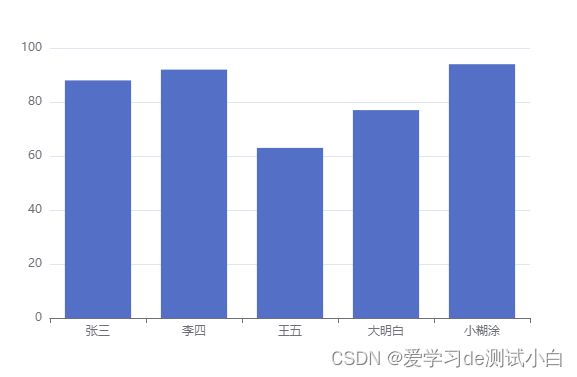
- 本篇来学习下柱状图的实现
柱状图实现步骤
- ECharts 最基本的代码结构
- 准备x轴的数据
- 准备 y 轴的数据
- 准备 option , 将 series 中的 type 的值设置为: bar
DOCTYPE html>
<html lang="en">
<head>
    <meta charset="UTF-8">
    <meta name="viewport" content="width=device-width, initial-scale=1.0">
    <meta http-equiv="X-UA-Compatible" content="ie=edge">
    <title>ECharts-柱状图title>
    <script src="https://cdn.jsdelivr.net/npm/[email protected]/dist/echarts.min.js">script>
head>

<body>
<div id='app' style="width: 600px;height: 400px">div>
<script>

    var myCharts = echarts.init(document.getElementById('app'))
    // 准备数据 将type的值设置为bar
    var xDataArr = ['张三', '李四', '王五', '大明白', '小糊涂'] // x轴数据
    var yDataArr = [88, 92, 63, 77, 94]  // y轴数据
    var option = {
        xAxis: {
            type: 'category',
            data: xDataArr
        },
        yAxis: {
            type: 'value'
        },
        series: [
            {
                name: '分数',
                type: 'bar',  // 图表类型  bar:柱状图   line:折线图   pie:饼图
                data: yDataArr
            }
        ]
    }
    // 将配置项设置给echarts实例对象
    myCharts.setOption(option)
script>
body>

html>
柱状图常见效果
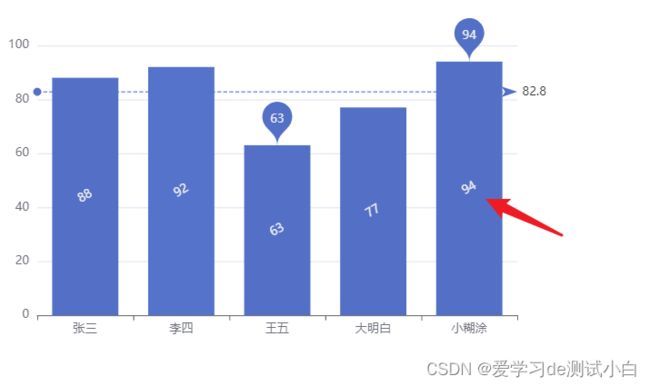
标记
- markPoint:最大值\最小值
markPoint: {   // 标记最大最小值
     data: [
            {type: 'max', name: '最大值'},
            {type: 'min', name: '最小值'}
        ]
    }
`
markLine: {
      data: [
             {
                 type: 'average', name: '平均值'
             }
         ]
     }
显示
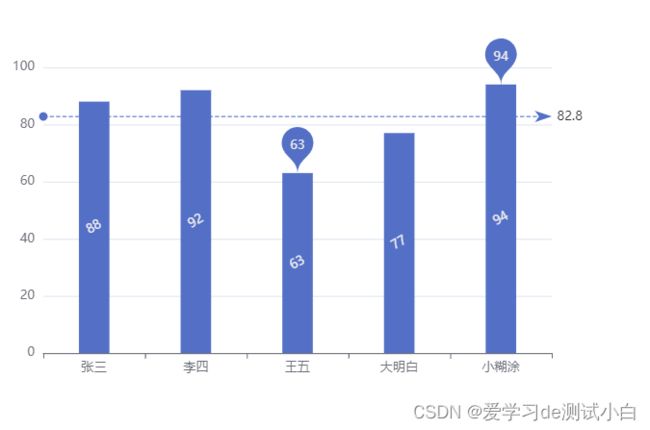
- lable:数值显示
 label: {
        show: true,  // 柱状图显示数值
        rotate: 30, // 值旋转角度
    }
barWidth: '30%' // 柱的宽度
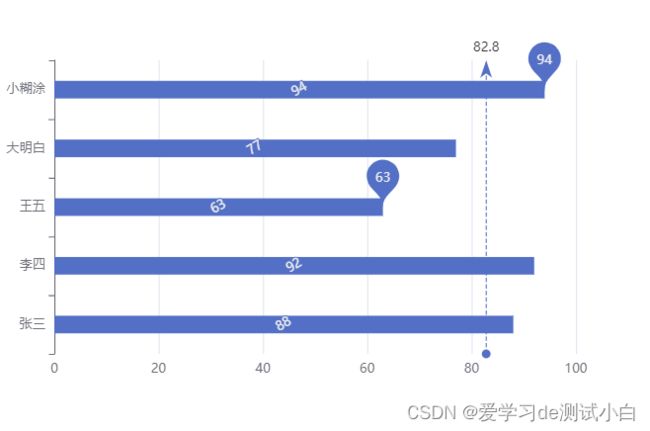
xAxis: {
            // type: 'category',
            // data: xDataArr
            type: 'value'
        },
        yAxis: {
            // type: 'value'
            type: 'category',
            data: xDataArr
        },
DOCTYPE html>
<html lang="en">

<head>
    <meta charset="UTF-8">
    <meta name="viewport" content="width=device-width, initial-scale=1.0">
    <meta http-equiv="X-UA-Compatible" content="ie=edge">
    <title>ECharts-柱状图title>

    <script src="https://cdn.jsdelivr.net/npm/[email protected]/dist/echarts.min.js">script>
head>

<body>

<div id='app' style="width: 600px;height: 400px">div>
<script>
    // 初始化echarts实例对象
    var myCharts = echarts.init(document.getElementById('app'))
    // 准备数据 将type的值设置为bar
    var xDataArr = ['张三', '李四', '王五', '大明白', '小糊涂'] // x轴数据
    var yDataArr = [88, 92, 63, 77, 94]  // y轴数据
    var option = {
        xAxis: {
            type: 'category',
            data: xDataArr
            // type: 'value'  // 横向柱状图使用
        },
        yAxis: {
            type: 'value'
            // type: 'category', // 横向柱状图使用
            // data: xDataArr
        },
        series: [
            {
                name: '分数',
                type: 'bar',  // 图表类型  bar:柱状图   line:折线图   pie:饼图
                data: yDataArr,
                markPoint: {   // 标记最大最小值
                    data: [
                        {type: 'max', name: '最大值'},
                        {type: 'min', name: '最小值'}
                    ]
                },
                markLine: {
                    data: [
                        {
                            type: 'average', name: '平均值'
                        }
                    ]
                },
                label: {
                    show: true,  // 柱状图显示数值
                    rotate: 30, // 值旋转角度
                },
                barWidth: '30%' // 柱的宽度
            }
        ]
    }
    // 将配置项设置给echarts实例对象
    myCharts.setOption(option)
script>
body>

html>


