Matplotlib中的imshow函数与Opencv中的imshow
imshow()函数
Matplotlib imshow() 函数声明
# Autogenerated by boilerplate.py.  Do not edit as changes will be lost.
@docstring.copy(Axes.imshow)
def imshow(
        X, cmap=None, norm=None, aspect=None, interpolation=None,
        alpha=None, vmin=None, vmax=None, origin=None, extent=None,
        shape=cbook.deprecation._deprecated_parameter, filternorm=1,
        filterrad=4.0, imlim=cbook.deprecation._deprecated_parameter,
        resample=None, url=None, *, data=None, **kwargs):
    __ret = gca().imshow(
        X, cmap=cmap, norm=norm, aspect=aspect,
        interpolation=interpolation, alpha=alpha, vmin=vmin,
        vmax=vmax, origin=origin, extent=extent, shape=shape,
        filternorm=filternorm, filterrad=filterrad, imlim=imlim,
        resample=resample, url=url, **({"data": data} if data is not
        None else {}), **kwargs)
    sci(__ret)
    return __ret
一些比较重要的参数解析:
- X : 可以是数组或者图片, shape只能是 (n, m) or (n, m, 3) or (n, m, 4)
X may be an array or a PIL image. If X is an array, it can have the following shapes and types:
//如果是数组的话,有以下约定

MxN – values to be mapped (float or int)//可以选择被映射,cmap可以自己选,默认RGB
MxNx3 – RGB (float or uint8)//只能是RGB,cmap为none,默认值,
MxNx4 – RGBA (float or uint8)//只能是RGBA,cmap为none,默认值
The value for each component of MxNx3 and MxNx4 float arrays should be in the range 0.0 to 1.0. MxN arrays are mapped to colors based on the norm (mapping scalar to scalar) and the cmap (mapping the normed scalar to a color).
//MxNx3和MxNx4浮点数组的值应该在0.0到1.0之间。MxN数组根据范数(将标量映射到标量)和cmap(将已赋范的标量映射到颜色)映射到颜色。
- cmap
颜色图谱(colormap), 默认绘制为RGB(A)颜色空间。
cmap : Colormap, optional, default: None
If None, default to rc image.cmap value. cmap is ignored if X is 3-D, directly specifying RGB(A) values. //3维数组使用默认值。
| 颜色图谱 | 值 |
|---|---|
| autumn | 红-橙-黄 |
| bone | 黑-白,x线 |
| cool | 青-洋红 |
| copper | 黑-铜 |
| flag | 红-白-蓝-黑 |
| gray | 黑-白 |
| hot | 黑-红-黄-白 |
| hsv | hsv颜色空间, 红-黄-绿-青-蓝-洋红-红 |
| inferno | 黑-红-黄 |
| jet | 蓝-青-黄-红 |
| magma | 黑-红-白 |
| pink | 黑-粉-白 |
| plasma | 绿-红-黄 |
| prism | 红-黄-绿-蓝-紫-…-绿模式 |
| spring | 洋红-黄 |
| summer | 绿-黄 |
| viridis | 蓝-绿-黄 |
Opencv imshow() 函数声明
C++: void imshow(const string& winname, InputArray mat)
Python: cv2.imshow(winname, mat) → None
C: void cvShowImage(const char* name, const CvArr* image)
Python: cv.ShowImage(name, image) → None
- imshow函数在指定的窗口中显示图像。如果窗口是用CV_WINDOW_AUTOSIZE标志创建的,则显示的是原始大小的图像,但是它仍然受到屏幕分辨率的限制。否则,图像被缩放以适应窗口。该函数可以缩放图像,取决于其深度:
如果图像是8位无符号的,则按原样显示。
如果图像是16位无符号或32位整数,则像素除以256。也就是说,将值范围[0,255*256]映射到[0,255]。
如果图像是32位浮点数,则像素值乘以255。也就是说,取值范围[0,1]被映射到[0,255]。 - 如果在此函数之前没有创建窗口,则假定使用CV_WINDOW_AUTOSIZE创建窗口。
如果需要显示比屏幕分辨率大的图像,则需要在imshow之前调用namedWindow("", WINDOW_NORMAL)。
如果窗口是用OpenGL支持创建的,imshow也支持ogl::Buffer, ogl::Texture2D和gpu::GpuMat作为输入。 - 与cv.waitKey()搭配使用,否则imshow显示很快,看不到图片。
异同
类似点
- 都要搭配一个函数,图片才能为我们所见:plt.imshow()搭配plt.show();cv.imshow搭配cv.waitKey();
- 都支持多种显示图片的色彩
不同点
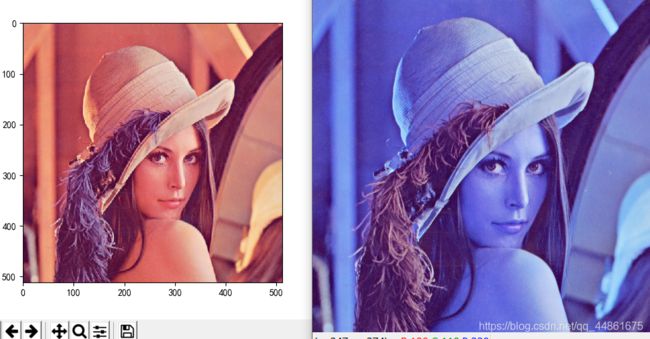
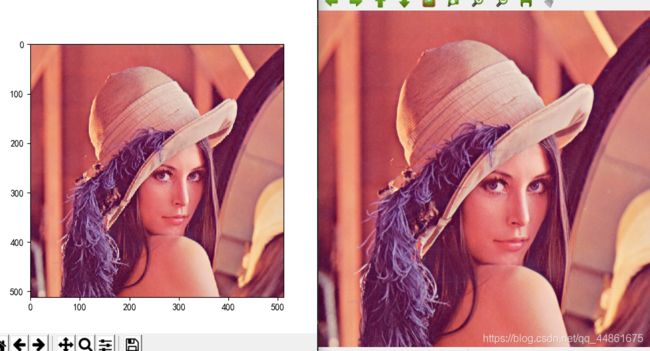
- matplotlib是读取RBG颜色通道的顺序是RGB,opencv是BGR,进而会导致一些图片显示的色差,所以我们需要对颜色通道进行一些处理。
- opencv imshow支持图片窗口的缩放,对图片的灰度选择性映射。而Matplotlib仅在二维数组映射
演示
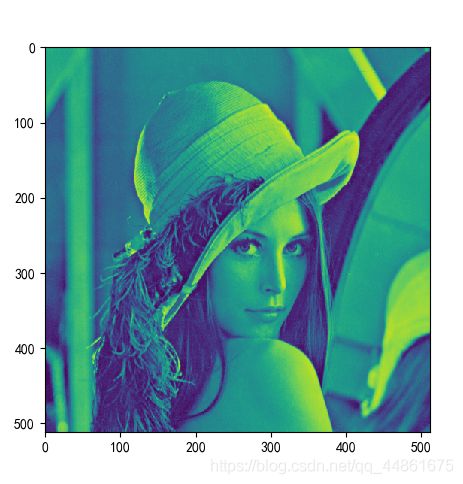
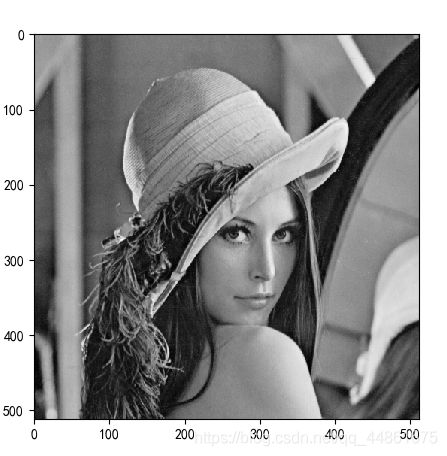
1.不指定cmp,无法显示灰度图
#读取图片
lena = Image.open("E:/浏览器下载文件/GOOgle/lena512color .jpg")
lena_L = lena.convert("L")
plt.imshow(lena_L)
#plt.imshow(lena_L,cmp="gray")#必须加上cmap=“gray",才能显示灰度图
2.二者的读取颜色通道不同
没处理颜色通道之前
#读取图片
lena = Image.open("E:/浏览器下载文件/GOOgle/lena512color .jpg")
plt.imshow(lena)#matplotlib显示
lena_1 = np.array(lena)
#print(lena_L1.dtype)
cv.imshow("lena",lena_1)
plt.show()
#读取图片
lena = Image.open("E:/浏览器下载文件/GOOgle/lena512color .jpg")
r,g,b = lena.split()#opencv,Image都是split,merge
lena_bgr = Image.merge("RGB",[b,g,r])
plt.imshow(lena)#matplotlib显示

lena_1 = np.array(lena_bgr)
#print(lena_L1.dtype)
cv.imshow("lena",lena_1)
plt.show()


