Python —— matplotlib库的温度图像绘制
使用的环境是Jupyter Notebook。我是安装了python版本Anaconda,已经内置了各种python包,可进入官网下载。
在Anaconda下安装Jupyter Notebook即可在web页面上进行代码编写。
在python中,matplotlib库用于图像的绘制,本文以温度统计图为例,介绍使用matplotlib库来绘制统计图的功能。主要用到的函数有figure,plot,show等,还有一些附加功能函数。
import matplotlib.pyplot as plt  #导入库定义为plt
import random
from pylab import mpl    #设置中文字体
mpl.rcParams["font.sans-serif"] = ["SimHei"]
mpl.rcParams["axes.unicode_minus"]=False
#0.准备数据
x= range(60)  #时间范围
y_shanghai = [random.uniform(13,17)for i in x]  #随机获取上海温度
y_beijing = [random.uniform(3,7)for i in x]  #随机获取北京温度
#1.创建画布
plt.figure(figsize=(20,8),dpi=100) #20x8,清晰度为100
#2.绘制图像
plt.plot(x,y_shanghai,label="上海")  #绘制折线图
plt.plot(x,y_beijing,color="r",linestyle="--",label="北京")
#2.1 添加x,y刻度
x_ticks_label=["11点{}分".format(i) for i in x]
y_ticks = range(40)
plt.xticks(x[::5],x_ticks_label[::5])#划分坐标刻度和定义标签刻度
plt.yticks(y_ticks[::5])
#2.2 添加网格显示
plt.grid(True,linestyle="--",alpha=1)
#2.3 添加描述信息
plt.xlabel("时间")
plt.ylabel("温度")
plt.title("中午11-12点城市温度变化图",fontsize=20)
#2.4 图像保存
plt.savefig("./test.png")
#2.5 显示图例
plt.legend(loc="best")
#3.图像显示
plt.show()
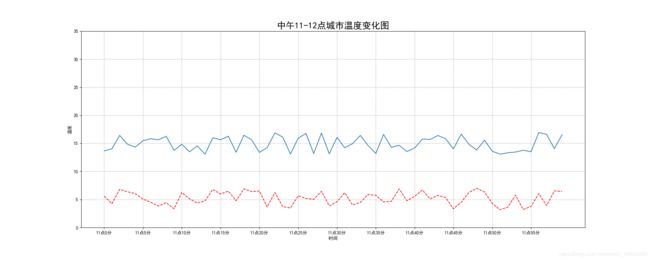
绘制结果演示:

除此之外,还可以用matplotlib绘制更加丰富复杂的图像,下面推荐一个网站https://matplotlib.org/里面介绍了各种matplotlib的使用方法,供大家参考。
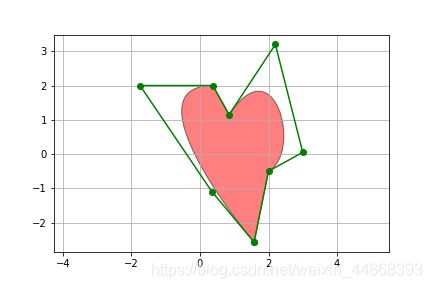
举个例子画一个心:
import matplotlib.path as mpath import matplotlib.patches as mpatches
import matplotlib.pyplot as pltfig, ax = plt.subplots()
Path = mpath.Path path_data = [
(Path.MOVETO, (1.58, -2.57)),
(Path.CURVE4, (0.35, -1.1)),
(Path.CURVE4, (-1.75, 2.0)),
(Path.CURVE4, (0.375, 2.0)),
(Path.LINETO, (0.85, 1.15)),
(Path.CURVE4, (2.2, 3.2)),
(Path.CURVE4, (3, 0.05)),
(Path.CURVE4, (2.0, -0.5)),
(Path.CLOSEPOLY, (1.58, -2.57)),
]
codes, verts = zip(*path_data)
path = mpath.Path(verts, codes)
patch = mpatches.PathPatch(path, facecolor=‘r’, alpha=0.5)
ax.add_patch(patch)x, y = zip(*path.vertices) line, = ax.plot(x, y, ‘go-’)
ax.grid() ax.axis(‘equal’) plt.show()
