爬虫——天气并数据可视化
任务要求:
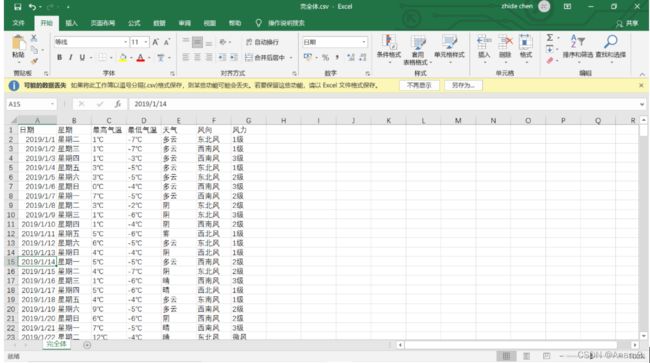
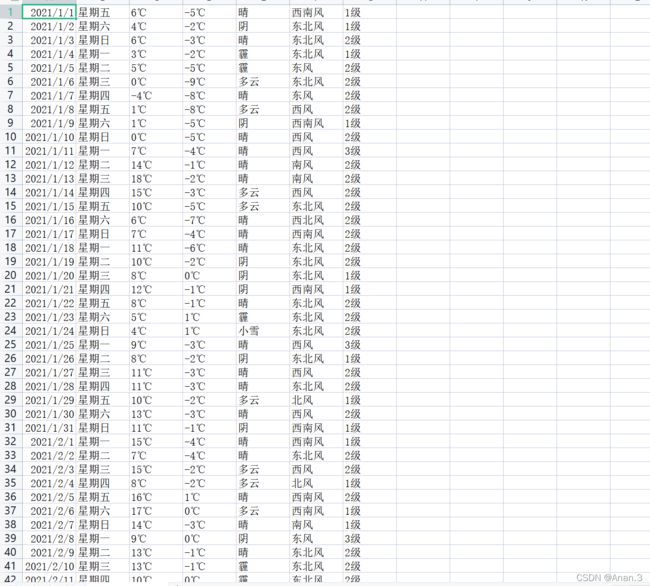
爬取天气网的历史天气数据,将其写入CSV 文件,格式如下图所示

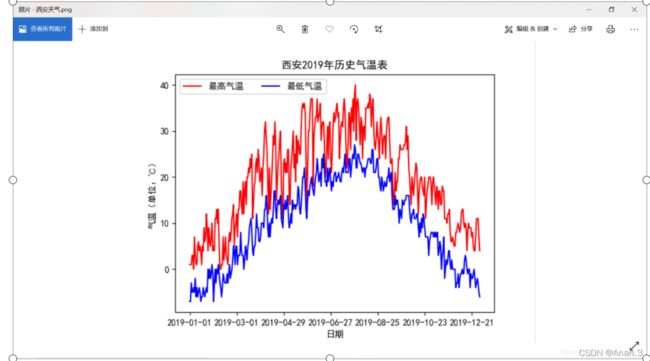
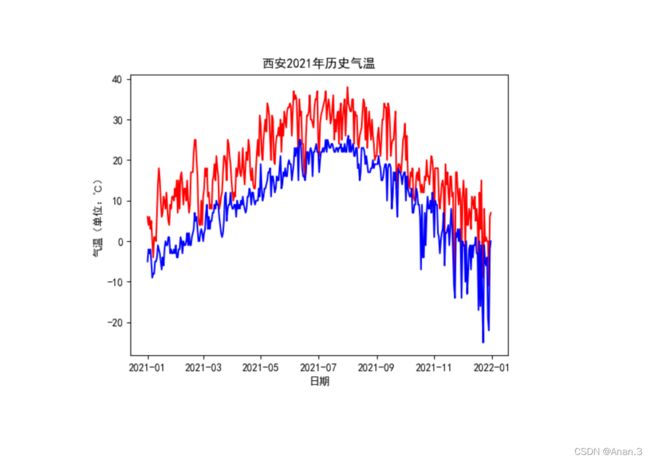
对爬取到的数据的最高气温和最低气温进行可视化,要求使用 matplotlib 模块, 按下图所示设置两条折线的颜色(其中最高气温使用红色,最低气温使用蓝色)、 x 轴和 y 轴的文字、x 轴的刻度、图的标题和图例,最终结果保存到当前工作目 录下,命名为“WeatherData.png”。
结果示例如下:

先导入所需要用到的包
import matplotlib.pyplot as plt
import numpy as np
import pandas as pd
import requests
from bs4 import BeautifulSoup
import csv
此时进行bs4爬取数据
with open('Xian_weather.csv','w',newline='') as file:
    w=csv.writer(file)
    w.writerow(['日期','星期','最高气温','最低气温','天气','风向','风力'])
    temp_high = []
    temp_low = []
    # 对首页的页面数据进行爬取
    for i in range(1,13):
        if i<10:
            month='0'+str(i)
        else:
            month=str(i)
        url=f'http://lishi.tianqi.com/xian/2021{month}.html'
        response=requests.get(url=url,headers=headers)
        text=response.text
        #用bs4进行解析
        soup=BeautifulSoup(text,'lxml')
        li_list=soup.select('.thrui > li')
        #将每行的数据写入到csv文件中,并且将最高最低气温存到相应的列表之中
        for j in range(len(li_list)):
            a = li_list[j].text
            info_list = a.split()
            temp_high.append(int(info_list[2].replace('℃', '')))
            temp_low.append(int(info_list[3].replace('℃', '')))
            w.writerow(info_list)
        print('2021' + month + '的数据写入成功!')
    print("写入文件成功!")
用matplotlib进行绘图
#由于文件名中含有中文会引起OSError,因此需要在后面加上engine='python'
df=pd.read_csv(r'C:\Users\Anan\PycharmProjects\爬虫\Xian_weather.csv',engine='python')

#为了防止中文乱码,在画图时需要加上这两句
plt.rcParams['font.sans-serif'] = ['SimHei']
plt.rcParams['axes.unicode_minus'] = False

#x轴代表的日期
x=pd.date_range('20210101',periods=365)
plt.plot(x, temp_high, 'r-', label='最高气温')
plt.plot(x, temp_low, 'b-', label='最低气温')

#标签,两条线所代表的内容
plt.legend()
plt.xlabel('日期')
plt.ylabel('气温(单位:℃)')
plt.title('西安2021年历史气温')
#给所画的图像进行命名
plt.savefig('./WeatherData.png')
plt.show()
总代码
import matplotlib.pyplot as plt
import numpy as np
import pandas as pd
import requests
from bs4 import BeautifulSoup
import csv

headers = {
        'User-Agent': 'Mozilla/5.0 (Windows NT 10.0; Win64; x64) AppleWebKit/537.36 (KHTML, like Gecko) Chrome/99.0.4844.51 Safari/537.36 Edg/99.0.1150.39'
    }

with open('Xian_weather.csv','w',newline='') as file:
    write=csv.writer(file)
    write.writerow(['日期','星期','最高气温','最低气温','天气','风向','风力'])

with open('Xian_weather.csv','w',newline='') as file:
    w=csv.writer(file)
    temp_high = []
    temp_low = []
    # 对首页的页面数据进行爬取
    for i in range(1,13):
        if i<10:
            month='0'+str(i)
        else:
            month=str(i)
        url=f'http://lishi.tianqi.com/xian/2021{month}.html'
        response=requests.get(url=url,headers=headers)
        text=response.text
        #用bs4进行解析
        soup=BeautifulSoup(text,'lxml')
        li_list=soup.select('.thrui > li')
        #将每行的数据写入到csv文件中,并且将最高最低气温存到相应的列表之中
        for j in range(len(li_list)):
            a = li_list[j].text
            info_list = a.split()
            temp_high.append(int(info_list[2].replace('℃', '')))
            temp_low.append(int(info_list[3].replace('℃', '')))
            w.writerow(info_list)
        print('2021' + month + '的数据写入成功!')
    print("写入文件成功!")

#由于文件名中含有中文会引起OSError,因此需要在后面加上engine='python'
df=pd.read_csv(r'C:\Users\Anan\PycharmProjects\爬虫\Xian_weather.csv',engine='python')

#为了防止中文乱码,在画图时需要加上这两句
plt.rcParams['font.sans-serif'] = ['SimHei']
plt.rcParams['axes.unicode_minus'] = False

#x轴代表的日期
x=pd.date_range('20210101',periods=365)
plt.plot(x, temp_high, 'r-', label='最高气温')
plt.plot(x, temp_low, 'b-', label='最低气温')

#标签,两条线所代表的内容
plt.legend()
plt.xlabel('日期')
plt.ylabel('气温(单位:℃)')
plt.title('西安2021年历史气温')
#给所画的图像进行命名
plt.savefig('./WeatherData.png')
plt.show()
本次爬虫小任务就告一段落了!!!

