【Python百日进阶-数据分析】Day326 - plotly.express.scatter_geo():地理散点图
文章目录
- 一、scatter_geo语法
- 二、参数
- 三、返回类型
- 四、实例
-
- 4.1 常规地理散点图
- 4.2自定义地理散点图
- 4.3GeoPandas 的基本示例
一、scatter_geo语法
plotly.express.scatter_geo(data_frame = None ,
                           lat = None ,
                           lon = None ,
                           locations = None ,
                           locationmode = None ,
                           geojson = None ,
                           featureidkey = None ,
                           color = None ,
                           text = None ,
                           symbol = None ,
                           facet_row = None ,
                           facet_col = None ,
                           facet_col_wrap =0,
                           facet_row_spacing = None,
                           facet_col_spacing = None,
                           hover_name = None,
                           hover_data = None,
                           custom_data = None,
                           size = None,
                           animation_frame = None,
                           animation_group = None,
                           category_orders = None,
                           labels = None,
                           color_discrete_sequence = None,
                           color_discrete= None ,
                           color_continuous_scale = None ,
                           range_color = None ,
                           color_continuous_midpoint = None ,
                           symbol_sequence = None ,
                           symbol_map = None ,
                           opacity = None ,
                           size_max = None ,
                           projection = None ,
                           scope = None ,
                           center = None ,
                           fitbounds = None ,
                           basemap_visible= None ,
                           title = None ,
                           template = None ,
                           width = None ,
                           height = None )
在地理散点图中,每一行data_frame由地图上的符号标记表示。
二、参数
-
data_frame ( DataFrame or array-like or dict ) – 这个参数需要传递给要使用的列名(而不是关键字名)。Array-like 和 dict 在内部转换为 Pandas DataFrame。可选:如果丢失,则使用其他参数在幕后构造一个 DataFrame。
-
lat ( str or int or Series or array-like ) – 中列的名称data_frame,或pandas Series或array_like对象。此列或array_like 中的值用于根据地图上的纬度定位标记。
-
lon ( str or int or Series or array-like ) – 中列的名称data_frame,或pandas Series或array_like对象。此列或array_like 中的值用于根据地图上的经度定位标记。
-
locations 位置(str或int或Series或array-like)– 中列的名称,data_frame或 Pandas Series 或 array_like 对象。此列或array_like 中的值将根据locationmode经度/纬度解释并映射到经度/纬度。
-
locationmode ( str ) – ‘ISO-3’、‘USA-states’ 或 ‘country names’ 之一确定用于将条目匹配locations到地图上的区域的位置集。
-
geojson ( GeoJSON-formatted dict ) – 必须包含一个 Polygon 特征集合,带有 ID,它们是来自locations.
-
featureidkey (str (default: ‘id’)) – GeoJSON 特征对象中字段的路径,与传入的值相匹配locations。默认值的最常见替代形式是’properties.。
-
color ( str or int or Series or array-like ) – 中列的名称data_frame,或pandas Series或array_like对象。此列或array_like 中的值用于为标记分配颜色。
-
text ( str or int or Series or array-like ) – 中列的名称data_frame,或pandas Series或array_like对象。此列或array_like 中的值在图中显示为文本标签。
-
symbol 符号(str或int或Series或类似数组)– 中列的名称,data_frame或 Pandas Series 或 array_like 对象。此列或array_like 中的值用于将符号分配给标记。
-
facet_row ( str or int or Series or array-like ) – 中列的名称data_frame,或pandas Series或array_like对象。此列或array_like 中的值用于在垂直方向为分面子图分配标记。
-
facet_col ( str or int or Series or array-like ) – 中列的名称data_frame,或pandas Series或array_like对象。此列或array_like 中的值用于将标记分配给水平方向的分面子图。
-
facet_col_wrap ( int ) – 分面列的最大数量。以此宽度包装列变量,以便列面跨越多行。如果为 0,则忽略,如果设置了facet_row或 a,marginal则强制为 0 。
-
facet_row_spacing ( float between 0 and 1 ) – 分面行之间的间距,以纸为单位。使用 facet_col_wrap 时,默认值为 0.03 或 0.0.7。
-
facet_col_spacing ( float between 0 and 1 ) – 分面列之间的间距,以纸为单位 默认为 0.02。
-
hover_name ( str or int or Series or array-like ) – 中列的名称data_frame,或者pandas Series或array_like对象。此列或类似数组的值在悬停工具提示中以粗体显示。
-
hover_data悬停数据(str或int列表,或Series或类似数组,或dict)–data_frame或 pandas Series 中的列名称列表,或类似数组的对象或以列名作为键的 dict,值为 True(默认情况下)格式) False(为了从悬停信息中删除此列),或格式字符串,例如 ‘:.3f’ 或 ’ | %a’ 或类似列表的数据出现在悬停工具提示或元组中,bool 或格式化字符串作为第一个元素,类似列表的数据出现在悬停中作为第二个元素这些列中的值在悬停工具提示中显示为额外数据.
-
custom_data(str或int列表,或Series或array-like)– 中列的名称data_frame,或 Pandas Series,或 array_like 对象这些列中的值是额外的数据,例如用于小部件或 Dash 回调。此数据不是用户可见的,但包含在图形发出的事件中(套索选择等)
-
size ( str or int or Series or array-like ) – 中列的名称data_frame,或pandas Series或array_like对象。此列或array_like 中的值用于分配标记大小。
-
animation_frame(str或int或Series或array-like)– 中列的名称,data_frame或 Pandas Series 或 array_like 对象。此列或array_like 中的值用于为动画帧分配标记。
-
animation_group(str或int或Series或array-like)– 中列的名称,data_frame或 Pandas Series 或 array_like 对象。来自此列或 array_like 的值用于提供跨动画帧的对象恒定性:具有匹配 “ animation_group”的行将被视为它们在每一帧中描述相同的对象。
-
category_orders(带有 str 键的字典和 str 值列表(默认{}))——默认情况下,在 Python 3.6+ 中,轴、图例和方面中分类值的顺序取决于这些值第一次遇到的顺序data_frame(并且没有3.6 以下的 Python 中默认保证顺序)。此参数用于强制对每列的值进行特定排序。这个字典的键应该对应于列名,值应该是与所需的特定显示顺序对应的字符串列表。
-labels 标签(带有 str 键和 str 值的字典(默认{}))——默认情况下,列名在图中用于轴标题、图例条目和悬停。这个参数允许它被覆盖。此字典的键应对应于列名,值应对应于要显示的所需标签。
-
color_discrete_sequence(str 列表)——字符串应该定义有效的 CSS 颜色。当color设置为 并且相应列中的值不是数字时,该列中的值通过color_discrete_sequence 按 中描述的顺序循环分配颜色category_orders,除非 的值 color是 中的键color_discrete_map。plotly.express.colors子模块中提供了各种有用的颜色序列,特别是plotly.express.colors.qualitative.
-
color_discrete_map(带有 str 键和 str 值的字典(默认{}))——字符串值应该定义有效的 CSS-colors 用于覆盖 color_discrete_sequence以将特定颜色分配给与特定值对应的标记。键入的color_discrete_map应该是由 表示的列中的值color。或者,如果 的值color是有效颜色,则’identity’可以传递字符串以直接使用它们。
-
color_continuous_scale ( str 列表) – 字符串应该定义有效的 CSS-colors 当 由 表示的列color包含数字数据时,此列表用于构建连续的颜色比例。plotly.express.colors子模块中提供了各种有用的色阶 ,特别 plotly.express.colors.sequential是plotly.express.colors.diverging 和plotly.express.colors.cyclical。
-
range_color(两个数字的列表)– 如果提供,则覆盖连续色标上的自动缩放。
-
color_continuous_midpoint (number (default None)) – 如果设置,计算连续色标的边界以获得所需的中点。使用plotly.express.colors.diverging色阶作为 的输入时, 建议设置此值 color_continuous_scale。
-
symbol_sequence(str 列表)——字符串应该定义有效的 plotly.js 符号。当symbol被设置时,该列中的值由通过循环分配的符号 symbol_sequence中的顺序描述category_orders,除非的值symbol是在一个关键symbol_map。
-
symbol_map(带有 str 键和 str 值的字典(默认{}))——字符串值应该定义 plotly.js 符号 用于覆盖symbol_sequence以将特定符号分配给与 特定值对应的标记。键入的symbol_map应该是由 表示的列中的值symbol。或者,如果 的值symbol 是有效的符号名称,则’identity’可以传递字符串以直接使用它们。
-
opacity ( float ) – 介于 0 和 1 之间的值。设置标记的不透明度。
-
size_max (int (default 20)) – 使用时设置最大标记大小size。
-
projection 投影(STR) -其中一个’equirectangular’,‘mercator’,‘orthographic’,,,,,, ,,,,,, ,,,, ,,,或。‘natural earth’‘kavrayskiy7’‘miller’‘robinson’‘eckert4’‘azimuthal equal area’‘azimuthal equidistant’‘conic equal area’‘conic conformal’‘conic equidistant’‘gnomonic’‘stereographic’‘mollweide’‘hammer’‘transverse mercator’‘albers usa’‘winkel tripel’‘aitoff’'sinusoidal’
Default depends onscope -
scope 范围(STR(默认’world’)。) -其中一个’world’,‘usa’,‘europe’,‘asia’,‘africa’,,或除非 被设置为,其力。‘north america’'south america’
Default is‘world’projection’albers usa’‘usa’ -
center ( dict ) – 字典键是’lat’和’lon’设置地图的中心点。
-
fitbounds(STR(默认False)。) -其中一个False,locations或geojson。
-
basemap_visible ( bool ) – 强制底图可见性。
-
title ( str ) – 图形标题。
-
template 模板(str或dict或plotly.graph_objects.layout.Template 实例)——图形模板名称(必须是 plotly.io.templates 中的一个键)或定义。
-
width (int (default None)) – 以像素为单位的图形宽度。
-
height (int (default None)) – 以像素为单位的图形高度。
三、返回类型
plotly.graph_objects.Figure
四、实例
4.1 常规地理散点图
import plotly.express as px
df = px.data.gapminder().query("year == 2007")
fig = px.scatter_geo(df, locations="iso_alpha",
                     size="pop", # size of markers, "pop" is one of the columns of gapminder
                     )
fig.show()

4.2自定义地理散点图
import plotly.express as px
df = px.data.gapminder().query("year == 2007")
fig = px.scatter_geo(df, locations="iso_alpha",
                     color="continent", # which column to use to set the color of markers
                     hover_name="country", # column added to hover information
                     size="pop", # size of markers
                     projection="natural earth")
fig.show()

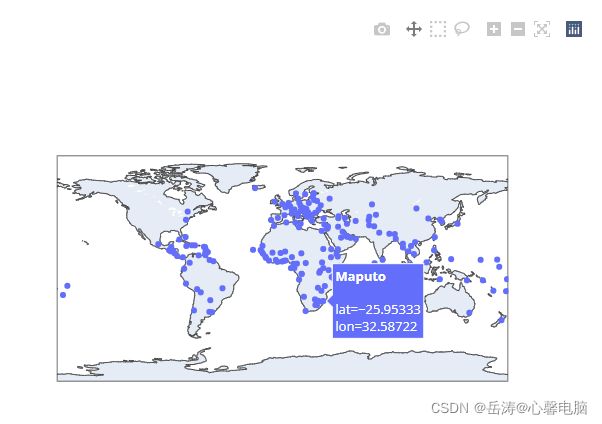
4.3GeoPandas 的基本示例
import plotly.express as px
import geopandas as gpd

geo_df = gpd.read_file(gpd.datasets.get_path('naturalearth_cities'))

px.set_mapbox_access_token(open(".mapbox_token").read())
fig = px.scatter_geo(geo_df,
                    lat=geo_df.geometry.y,
                    lon=geo_df.geometry.x,
                    hover_name="name")
fig.show()