基于AIE的贵阳市冷热岛分析
基于 Landsat-8 数据进行贵阳市冷热岛分析
初始化环境
import aie

aie.Authenticate()
aie.Initialize()
Landsat-8 数据检索
指定区域、时间、云量检索 Landsat-8 ,并对数据进行去云处理。
region = aie.FeatureCollection('China_City') \
            .filter(aie.Filter.eq('city', '贵阳市')) \
            .geometry()
dataset = aie.ImageCollection('LANDSAT_LC08_C02_T1_L2') \
             .filterBounds(region) \
             .filterDate('2021-05-01', '2021-10-1') \
             .filter(aie.Filter.lte('eo:cloud_cover', 30.0))

print(dataset.size().getInfo())
Landsat-8 数据去云
def removeLandsatCloud(image):
    cloudShadowBitMask = (1 << 4)
    cloudsBitMask = (1 << 3)
    qa = image.select('QA_PIXEL')
    mask = qa.bitwiseAnd(aie.Image(cloudShadowBitMask)).eq(aie.Image(0)).And(qa.bitwiseAnd(aie.Image(cloudsBitMask)).eq(aie.Image(0)))
    return image.updateMask(mask)
# median运算
image = dataset.median()
# clip裁剪
image = image.clip(region)
# 去云
# 去云会造成数据缺失,所以我这里不去云了
# image = removeLandsatCloud(image)
map = aie.Map(
    center=image.getCenter(),
    height=800,
    zoom=7
)
rgb_params = {
    'bands': ['SR_B4', 'SR_B3', 'SR_B2'],
    'min': 8000,
    'max': 13000
}
map.addLayer(
    image,
    rgb_params,
    'raw_img',
    bounds = image.getBounds()
)
map
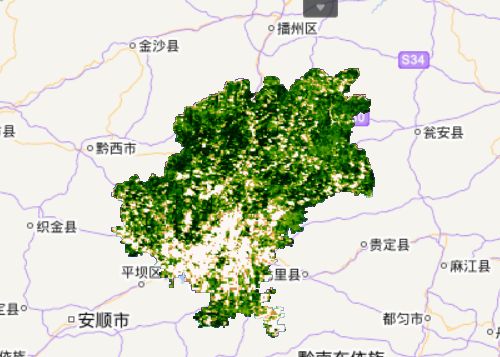
计算 NDVI
ndvi计算 NIR-R/NIR+R
ndvi = image.normalizedDifference(['SR_B5', 'SR_B4']).rename(['NDVI'])
ndvi_params = {
    'min': 0,
    'max': 1.0,
    'palette': [
        '#FFFFFF', '#CE7E45', '#DF923D', '#F1B555', '#FCD163', '#99B718', '#74A901',
        '#66A000', '#529400', '#3E8601', '#207401', '#056201', '#004C00', '#023B01',
        '#012E01', '#011D01', '#011301'
    ]
}

map.addLayer(
    ndvi,
    ndvi_params,
    'NDVI',
    bounds = image.getBounds()
)
map
task = aie.Export.image.toAsset(ndvi,'guiyang_ndvi',50)
task.start()
计算 Fractional Vegetation
植被覆盖度计算 NDVI-NDVI_min / NDVI_max-NDVI_min
import numpy as np

scale = 1000

histogram = ndvi.reduceRegion(aie.Reducer.histogram(2000), None, scale)
histogram_info = histogram.getInfo()
# print(histogram_info)


bucketKey = histogram_info['NDVI_range']
bucketValue = histogram_info['NDVI_counts']

key = np.array(bucketValue)
accSum = np.cumsum(key)
# print(accSum[20])
# print(accSum[-1])
accPercent = accSum / accSum[-1]

p2 = np.searchsorted(accPercent, 0.2)

min_ndvi = bucketKey[p2 + 1]
print('min_ndvi:%f' % min_ndvi)

p98 = np.searchsorted(accPercent, 0.98)
max_ndvi = bucketKey[p98]
print('max_ndvi:%f' % max_ndvi)
min = aie.Image(min_ndvi)
max = aie.Image(max_ndvi)
fv = ndvi.where(ndvi.lt(min),aie.Image(0))\
           .where(ndvi.gt(max),aie.Image(1))\
           .where(ndvi.gt(min).And(ndvi.lt(max)),\
           ndvi.subtract(min).divide(max.subtract(min)))\
           .rename(['FV'])
fv_params = {
    'min': 0,
    'max': 1
}
map.addLayer(
    fv,
    fv_params,
    'fv',
    bounds = image.getBounds()
)
map
计算比辐射率 Emissivity
em = ndvi.where(ndvi.lte(aie.Image(0.2)),aie.Image(0.995))\
           .where(ndvi.gt(aie.Image(0.2)).And(ndvi.lt(aie.Image(0.4))),\
                  aie.Image(0.9589).add((aie.Image(0.086)).multiply(fv))\
                  .subtract(aie.Image(0.0617).multiply(fv).pow(aie.Image(2))))\
           .where(ndvi.gte(aie.Image(0.4)),aie.Image(0.9625).add(aie.Image(0.0614))\
                  .multiply(fv).subtract(aie.Image(0.0461)).multiply(fv).pow(aie.Image(2)))\
           .rename(['EM'])
scale = 1000

histogram = em.reduceRegion(aie.Reducer.mean())
histogram_info = histogram.getInfo()
print(histogram_info)
histogram = em.reduceRegion(aie.Reducer.max())
histogram_info = histogram.getInfo()
print(histogram_info)
histogram = em.reduceRegion(aie.Reducer.min())
histogram_info = histogram.getInfo()
print(histogram_info)
计算 Thermal
同温黑体辐射亮度计算
th = image.select('ST_B10').multiply(aie.Image(0.00341802)).add(aie.Image(149)).rename(['TH'])
scale = 1000

histogram = th.reduceRegion(aie.Reducer.mean())
histogram_info = histogram.getInfo()
print(histogram_info)
histogram = th.reduceRegion(aie.Reducer.max())
histogram_info = histogram.getInfo()
print(histogram_info)
histogram = th.reduceRegion(aie.Reducer.min())
histogram_info = histogram.getInfo()
print(histogram_info)
th_params = {
    'min': 240,
    'max': 330,
    'palette': [
        '#0000FF', '#FFFFFF', '#008000'
    ]
}
map.addLayer(
    th,
    th_params,
    'thermal',
    bounds = image.getBounds()
)
map
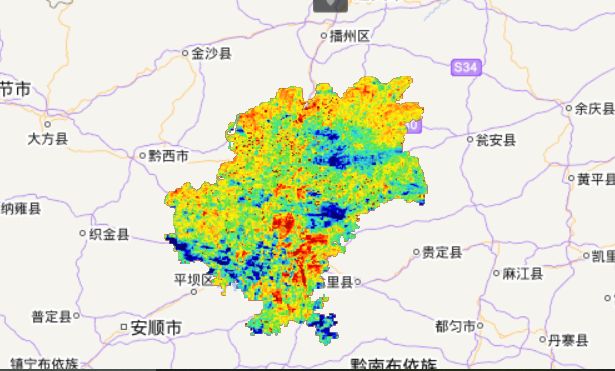
计算地表温度 ( LST )
tb = th.select(['TH'])
eb = em.select(['EM'])

lst = tb.divide(tb.multiply(aie.Image(0.00115)).divide(aie.Image(1.4388)).multiply(eb.log())\
                  .add(aie.Image(1))).subtract(aie.Image(273)).rename(['LST'])
scale = 1000

histogram = lst.reduceRegion(aie.Reducer.mean())
histogram_info = histogram.getInfo()
print(histogram_info)
histogram = lst.reduceRegion(aie.Reducer.max())
histogram_info = histogram.getInfo()
print(histogram_info)
histogram = lst.reduceRegion(aie.Reducer.min())
histogram_info = histogram.getInfo()
print(histogram_info)

histogram = lst.reduceRegion(aie.Reducer.histogram(2000), None, scale)
histogram_info = histogram.getInfo()
# print(histogram_info)
bucketKey = histogram_info['LST_range']
bucketValue = histogram_info['LST_counts']

key = np.array(bucketValue)
accSum = np.cumsum(key)
# print(accSum[20])
# print(accSum[-1])
accPercent = accSum / accSum[-1]

p1 = np.searchsorted(accPercent, 0.01)

min_lst = bucketKey[p1 + 1]
print('min_LST:%f' % min_lst)

p99 = np.searchsorted(accPercent, 0.99)
max_lst = bucketKey[p99]
print('max_LST:%f' % max_lst)
消除lst噪点
用1%和99%消除噪点
# 消除噪点,用1%和99.9%消除噪点
lst = lst.where(lst.lte(aie.Image(10)),aie.Image(10))\
           .where(lst.gt(aie.Image(10)).And(ndvi.lt(aie.Image(44))),lst)\
           .where(lst.gte(aie.Image(44)),aie.Image(44))
lst_params = {
    'min': 10,
    'max': 45,
    'palette': ['#040274', '#040281', '#0502a3', '#0502b8', '#0502ce', '#0502e6',
                '#0602ff', '#235cb1', '#307ef3', '#269db1', '#30c8e2', '#32d3ef',
                '#3be285', '#3ff38f', '#86e26f', '#3ae237', '#b5e22e', '#d6e21f',
                '#fff705', '#ffd611', '#ffb613', '#ff8b13', '#ff6e08', '#ff500d',
                '#ff0000', '#de0101', '#c21301', '#a71001', '#911003']
}

map.addLayer(
    lst,
    lst_params,
    'lst',
    bounds = image.getBounds()
)
map
task = aie.Export.image.toAsset(lst,'lst',50)
task.start()
城市冷热岛分析
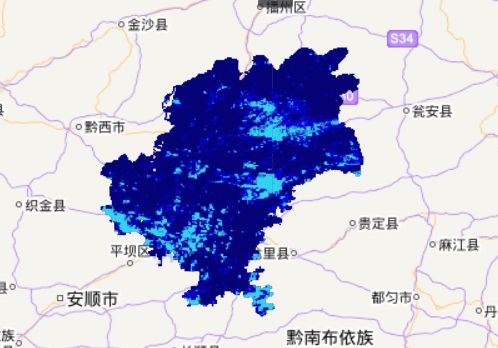
城市冷岛分析
scale = 1000

histogram = lst.reduceRegion(aie.Reducer.mean())
histogram_info = histogram.getInfo()
print(histogram_info)
mean_lst =  aie.Image(histogram_info.get('LST_mean'))

# subtract运算
uci =  lst.subtract(mean_lst)

# lst二分类,将lst小于0的区域设置为1,将lst大于0的区域设置为nodata
uci_extent = lst.where(lst.lte(mean_lst),aie.Image(1))\
           .where(lst.gt(mean_lst),aie.Image(0))


uci_final = lst.where(lst.lte(mean_lst),uci)\
           .where(lst.gt(mean_lst),aie.Image(0))
task = aie.Export.image.toAsset(uci_final,'guiyang_uci_final',50)
task.start()
mask_vis  = {
    'min': 0,
    'max': 1,
    'palette': ['#ffffff', '#0000cd']    # 0:白色, 1:蓝色
}

map.addLayer(uci_extent,mask_vis, 'uci_extent', bounds=region.getBounds())    # 蓝色区域为冷岛
histogram = uci_final.reduceRegion(aie.Reducer.min())
histogram_info = histogram.getInfo()
print(histogram_info)
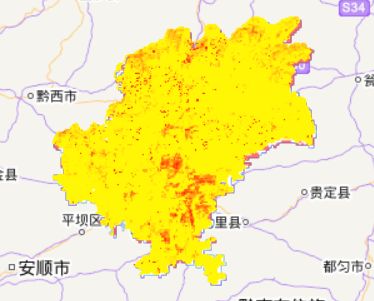
城市热岛分析
tr =  lst.subtract(mean_lst).divide(mean_lst)
# lst二分类,将lst小于0的区域设置为1,将lst大于0的区域设置为nodata
uhi_extent = tr.where(tr.lt(aie.Image(0)),aie.Image(0))\
               .where(tr.gt(aie.Image(0)),aie.Image(1))
mask_vis  = {
    'min': 0,
    'max': 1,
    'palette': ['#ffffff', '#ff7070']    # 0:白色, 1:红色
}


map.addLayer(uhi_extent,mask_vis, 'uhi_extent', bounds=region.getBounds())    # 红色区域为热岛
uhi_final = uhi_extent.multiply(tr)
task = aie.Export.image.toAsset(tr,'guiyang_uhi_final',50)
task.start()
uhi_params  = {
    'min': 0.1,
    'max': 0.8,
    'palette': ['#fff705', '#ffd611', '#ffb613', '#ff8b13', '#ff6e08', '#ff500d',
                '#ff0000', '#de0101', '#c21301', '#a71001', '#911003']
}


map.addLayer(uhi_final,uhi_params, 'uhi_final', bounds=region.getBounds())
总结
总的来说,这个不难,难在精准,难在精准的地表温度反演,比如我遇到的异常值问题,需要去除噪点。还有就是阿里云的小哥哥们很热心,也多亏他们的帮助,当然我这个地表温度反演做的比较简单,也不是很准确,希望大家有更加准确的算法。这个实验还是比较好的拟合了贵阳市的实际,也说明AIE可以很好的使用。
本文主要引用了AIE的官方案例,《城市与区域规划空间分析实验教程》的实验19,还有网络上使用ENVI利用landsat8数据进行地表温度反演的例子。


