OpenCV:直方图均衡
步骤:
第 1 步:手动均衡
第 2 步:通过使用 OpenCV 函数
什么是图像直方图?
它是图像强度分布的图形表示。它量化了所考虑的每个强度值的像素数。
第 1 步:手动均衡
%matplotlib inline
from IPython.display import display, Math, Latex
import numpy as np
import matplotlib.pyplot as plt
from PIL import Image
img = Image.open('DATA/einstein.jpg')
plt.imshow(img)
输出:
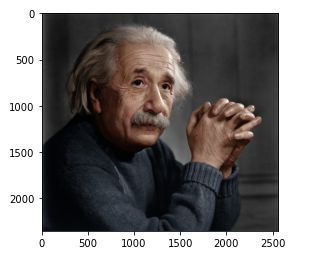
显示彩色图像
将图像转换为 numpy 数组,以便 OpenCV 可以使用:
img = np.asanyarray(img)
img.shape
输出:
(2354, 2560, 3)将 RGB 转换为灰度:
import cv2
img = cv2.cvtColor(img, cv2.COLOR_BGR2GRAY)
img.shape
输出:
(2354, 2560)显示图像:
plt.imshow(img, cmap='gray')输出:
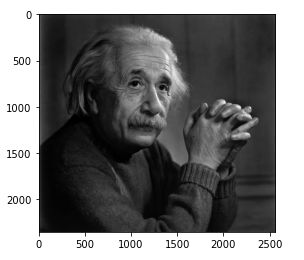
我们现在知道如何处理直方图了
img.max()输出:
255img.min()输出:
0img.shape输出:
(2354, 2560)把它展平:
flat = img.flatten()
# 1 row 2354 x 2560 = 6.026.240

flat.shape
输出:
(6026240,)显示直方图
plt.hist(flat, bins=50)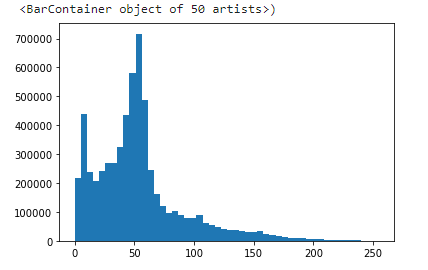
请注意,灰度值在某个值周围分布很差
什么是直方图均衡?
为了更清楚,从上图中,你可以看到像素似乎聚集在可用强度范围的中间。直方图均衡所做的就是扩大这个范围。
# formula for creating the histogram
display(Math(r'P_x(j) = \sum_{i=0}^{j} P_x(i)'))
# create our own histogram function

def get_histogram(image, bins):
  # array with size of bins, set to zeros
  histogram = np.zeros(bins)
  # loop through pixels and sum up counts of pixels
  for pixel in image:
    histogram[pixel] += 1
    # return our final result
    return histogram
hist = get_histogram(flat, 256)
plt.plot(hist)[] 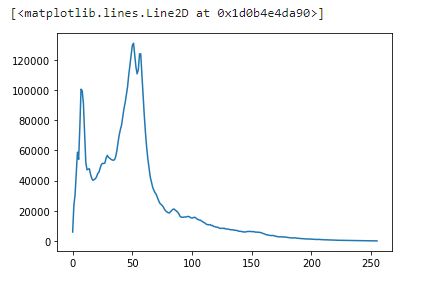
# create our cumulative sum function
def cumsum(a):
  a = iter(a)
  b = [next(a)]
  for i in a:
    b.append(b[-1] + i)
    return np.array(b)

# execute the fn
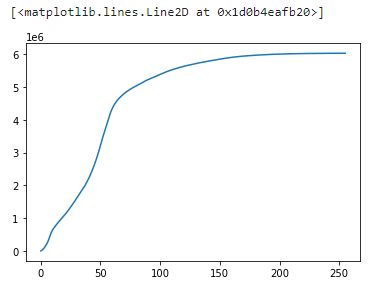
cs = cumsum(hist)

# display the result
plt.plot(cs)
[] 
# formula to calculate cumulation sum

display(Math(r's_k = \sum_{j=0}^{k} {\frac{n_j}{N}}'))
# re-normalize cumsum values to be between 0-255
# numerator & denomenator
nj = (cs - cs.min()) * 255
N = cs.max() - cs.min()

# re-normalize the cdf
cs = nj / N
plt.plot(cs)[] Casting:
# cast it back to uint8 since we can't use floating point values in images
cs = cs.astype('uint8')
plt.plot(cs)
输出:
[] 获取 CDF:
# get the value from cumulative sum for every index in flat, and set that as img_new
img_new = cs[flat]

# we see a much more evenly distributed histogram
plt.hist(img_new, bins=50)
它是如何工作的?
均衡意味着将一个分布(给定的直方图)映射到另一个分布(强度值的更广泛和更均匀的分布),因此强度值分布在整个范围内。
# get the value from cumulative sum for every index in flat, and set that as img_new
img_new = cs[flat]

# we see a much more evenly distributed histogram
plt.hist(img_new, bins=50)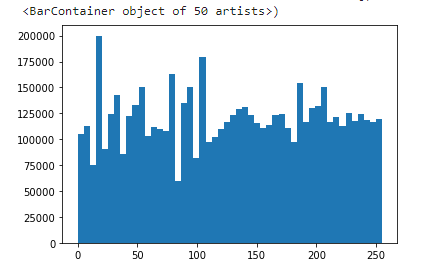
# put array back into original shape since we flattened it
img_new = np.reshape(img_new, img.shape)
img_new
输出:
array([[233, 231, 228, ..., 216, 216, 215],
       [233, 230, 228, ..., 215, 215, 214],
       [233, 231, 229, ..., 213, 213, 212],
       ...,
       [115, 107,  96, ..., 180, 187, 194],
       [111, 103,  93, ..., 187, 189, 192],
       [111, 103,  93, ..., 187, 189, 192]], dtype=uint8)
一探究竟:
# set up side-by-side image display
fig = plt.figure()
fig.set_figheight(15)
fig.set_figwidth(15)
fig.add_subplot(1,2,1)
plt.imshow(img, cmap='gray')

# display the new image
fig.add_subplot(1,2,2)
plt.imshow(img_new, cmap='gray')
plt.show(block=True)
使用 OpenCV equalizeHist(img) 方法
第 2 步:通过使用 OpenCV 函数
# Reading image via OpenCV and Equalize it right away!
img = cv2.imread('DATA/einstein.jpg',0)
equ = cv2.equalizeHist(img)
准备好!这就是你需要做的!
fig = plt.figure()
fig.set_figheight(15)
fig.set_figwidth(15)
fig.add_subplot(1,2,1)
plt.imshow(img, cmap='gray')

# display the Equalized (equ) image
fig.add_subplot(1,2,2)
plt.imshow(equ, cmap='gray')
plt.show(block=True)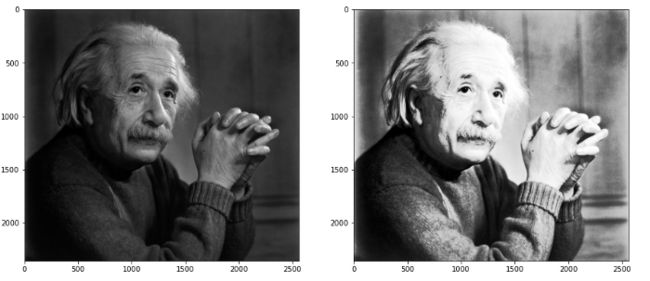
print("That´s it! Thank you once again!\nI hope will be helpful.")输出:
That´s it! Thank you once again!
I hope will be helpful.
木星笔记本链接:https://drive.google.com/file/d/1xWwLLGZF1XRA9ua97upcCXOssi1Z-s7k/view?usp=sharing
Github:https://github.com/giljr/pyImage
参考:
https://www.udemy.com/course/python-for-computer-vision-with-opencv-and-deep-learning/
https://en.wikipedia.org/wiki/Haar-like_feature
☆ END ☆
如果看到这里,说明你喜欢这篇文章,请转发、点赞。微信搜索「uncle_pn」,欢迎添加小编微信「 woshicver」,每日朋友圈更新一篇高质量博文。
↓扫描二维码添加小编↓
