sklearn谱聚类并确定最佳聚类数目
python自带的sklearn就可以实现谱聚类
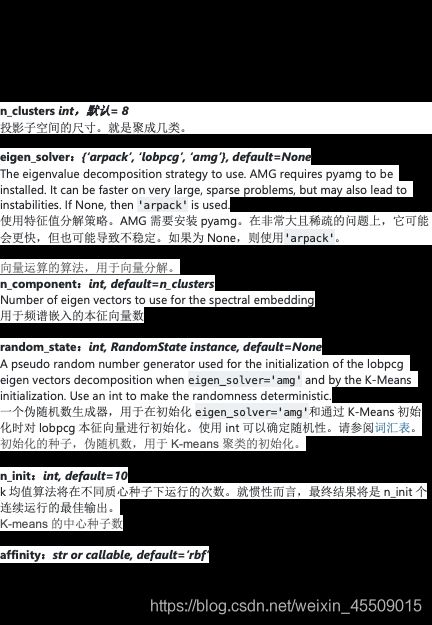
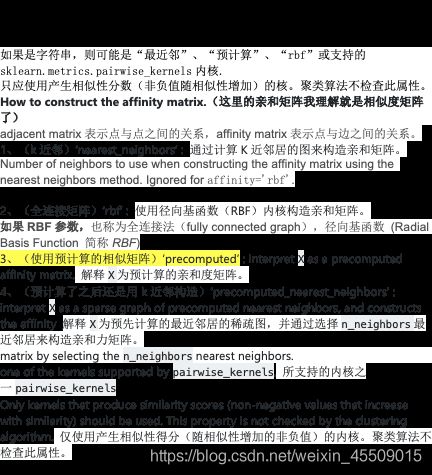
这里给出各参数介绍
以及实现实例:谱聚类对已经给出的相似度矩阵进行聚类,然后使用轮廓系数和ch系数确定最佳簇数。
原网址:https://scikit-learn.org/stable/modules/generated/sklearn.cluster.SpectralClustering.html#sklearn.cluster.SpectralClustering
调用函数的形式:
from sklearn.cluster import SpectralClustering
from sklearn import metrics
import pandas as pd
import numpy as np
import matplotlib.pyplot as plt
Scores = [0]  # 存放轮廓系数,根据轮廓系数的计算公式,只有一个类簇时,轮廓系数为0
Scores1 = [0]   # 存放AH系数,根据轮廓系数的计算公式,只有一个类簇时,系数为0

A = np.array([
              [0, 0, 0, 20, 0, 40],
              [0, 0, 57, 0, 0, 57],
              [0, 0, 0, 0, 57, 57],
              [0, 0, 0, 0, 0, 40],
              [57, 0, 0, 0, 0, 114],
              [0, 0, 0, 0, 0, 0]
              ])
for k in range(2,6):
    estimator = SpectralClustering(n_clusters=k,random_state=0,affinity='precomputed').fit_predict(A)
    Scores.append(metrics.silhouette_score(A, estimator, metric='euclidean'))
    # 为Score列表添加质量度量值
    Scores1.append(metrics.calinski_harabasz_score(A, estimator))
print(Scores)
print(Scores1)
i = range(2, 7)
plt.xlabel('k')
plt.ylabel('value')
plt.plot(i,Scores,'g.-',i,Scores1,'b.-')
# silhouette_score是绿色(数值越大越好) calinski_harabasz_score是蓝色(数值越大越好)
plt.show()
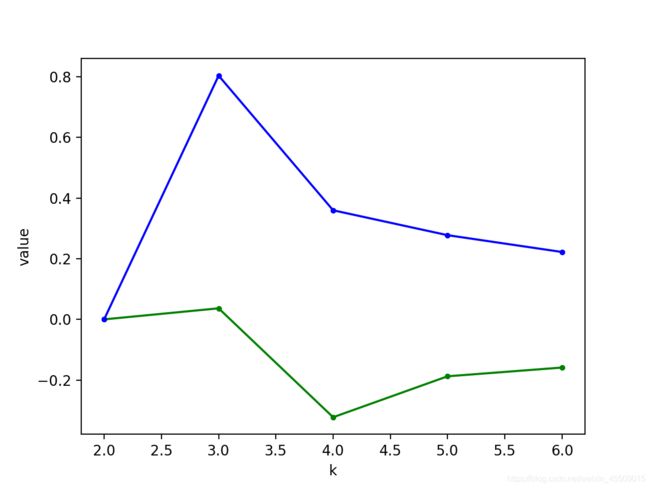
输出结果:横坐标是聚类个数
纵坐标是聚类指标值
蓝色折线是 calinski_harabasz_score
绿色是 silhouette_score 轮廓系数,两个指标都是越大说明聚类效果越好,由图可知,簇数为3,得到最佳聚类效果。


