全网最全激活函数图像绘制
目录
前言
单张绘制
代码
绘制结果
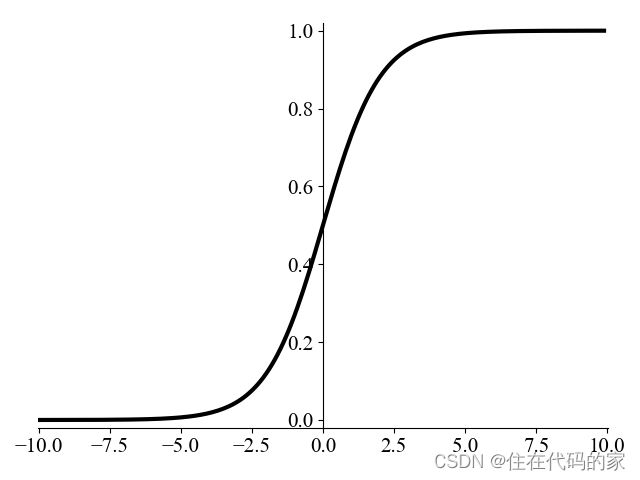
Sigmoid
Tanh
ReLU
Leaky_ReLU
Mish
多张绘图画在一张图上
代码
绘制结果
前言
一键运行即可绘制Sigmoid、Tanh、ReLU、Leaky_ReLU和Mish等激活函数
单张绘制
代码
import numpy as np
import matplotlib.pyplot as plt
from vtkmodules.numpy_interface.algorithms import ln

# 0 设置字体
plt.rc('font',family='Times New Roman', size=15)

# 1.1 定义sigmoid函数
def sigmoid(x):
    return 1. / (1 + np.exp(-x))
# 1.2 定义tanh函数
def tanh(x):
    return (np.exp(x) - np.exp(-x)) / (np.exp(x) + np.exp(-x))
# 1.3 定义relu函数
def relu(x):
    return np.where(x < 0, 0, x)
# 1.4 定义prelu函数
def Leaky_ReLU(x):
    return np.where(x<0, x * 0.5, x)
def Mish(x):
    return x * tanh(ln(1 +np.exp(x)))

# 2.1 定义绘制函数sigmoid函数
def plot_sigmoid():
    x = np.arange(-10, 10, 0.1)
    y = sigmoid(x)
    fig = plt.figure()#如果使用plt.figure(1)表示定位(创建)第一个画板,如果没有参数默认创建一个新的画板,如果plt.figure(figsize = (2,2)) ,表示figure 的大小为宽、长
    ax = fig.add_subplot(111)#表示前面两个1表示1*1大小,最后面一个1表示第1个
    ax.spines['top'].set_color('none')#ax.spines设置坐标轴位置,set_color设置坐标轴边的颜色
    ax.spines['right'].set_color('none')
    ax.spines['left'].set_position(('data', 0))
    ax.plot(x, y,color="black", lw=3)#设置曲线颜色,线宽
    plt.xticks(fontsize=15)#设置坐标轴的刻度子字体大小
    plt.yticks(fontsize=15)
    plt.xlim([-10.05, 10.05])#设置坐标轴范围
    plt.ylim([-0.02, 1.02])
    plt.tight_layout()#自动调整子图参数
    plt.show()#显示绘图
# 2.2 定义绘制函数tanh函数
def plot_tanh():
    x = np.arange(-10, 10, 0.1)
    y = tanh(x)
    fig = plt.figure()
    ax = fig.add_subplot(111)
    ax.spines['top'].set_color('none')
    ax.spines['right'].set_color('none')
    ax.spines['left'].set_position(('data', 0))
    ax.spines['bottom'].set_position(('data', 0))
    ax.plot(x, y, color="black", lw=3)
    plt.xticks(fontsize=15)
    plt.yticks(fontsize=15)
    plt.xlim([-10.05, 10.05])
    plt.ylim([-0.02, 1.02])
    ax.set_yticks([-1.0, -0.5, 0.5, 1.0])
    ax.set_xticks([-10, -5, 5, 10])
    plt.tight_layout()
    plt.show()
# 2.3 定义绘制函数relu函数
def plot_relu():
    x = np.arange(-10, 10, 0.1)
    y = relu(x)
    fig = plt.figure()
    ax = fig.add_subplot(111)
    ax.spines['top'].set_color('none')
    ax.spines['right'].set_color('none')
    ax.spines['left'].set_position(('data', 0))
    ax.plot(x, y, color="black", lw=3)
    plt.xticks(fontsize=15)
    plt.yticks(fontsize=15)
    plt.xlim([-10.05, 10.05])
    plt.ylim([-0.02, 1.02])
    ax.set_yticks([2, 4, 6, 8, 10])
    plt.tight_layout()
    plt.show()
# 2.4 定义绘制函数Leaky_ReLU函数
def plot_Leaky_relu():
    x = np.arange(-10, 10, 0.1)
    y = Leaky_ReLU(x)
    fig = plt.figure()
    ax = fig.add_subplot(111)
    ax.spines['top'].set_color('none')
    ax.spines['right'].set_color('none')
    ax.spines['left'].set_position(('data', 0))
    ax.spines['bottom'].set_position(('data', 0))
    ax.plot(x, y, color="black", lw=3)
    plt.xticks(fontsize=15)
    plt.yticks(fontsize=15)
    plt.tight_layout()
    plt.show()
def plot_Mish():
    x = np.arange(-10, 10, 0.1)
    y = Mish(x)
    fig = plt.figure()
    ax = fig.add_subplot(111)
    ax.spines['top'].set_color('none')
    ax.spines['right'].set_color('none')
    ax.spines['left'].set_position(('data', 0))
    ax.spines['bottom'].set_position(('data', 0))
    ax.plot(x, y, color="black", lw=3)
    plt.xticks(fontsize=15)
    plt.yticks(fontsize=15)
    plt.tight_layout()
    plt.show()

# 3 运行程序
plot_sigmoid()
plot_tanh()
plot_relu()
plot_Leaky_relu()
plot_Mish()
绘制结果
Sigmoid
Tanh

ReLU

Leaky_ReLU
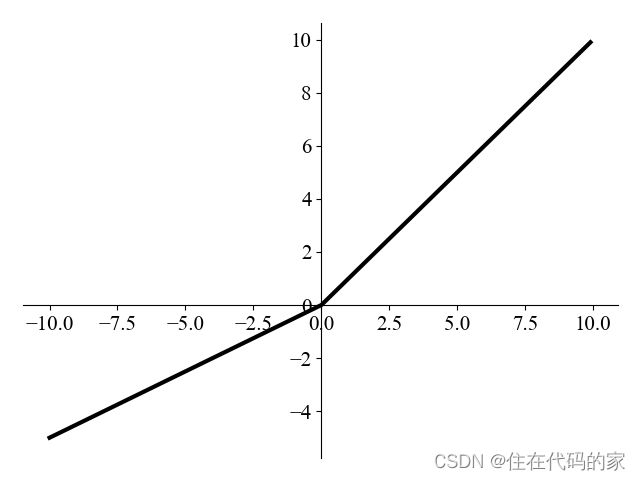
Mish

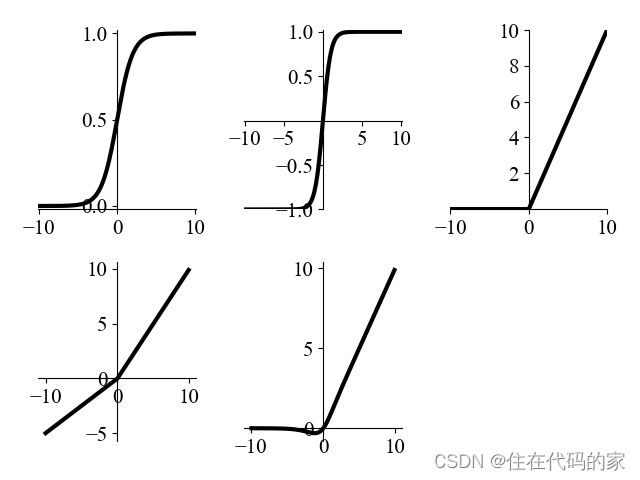
多张绘图画在一张图上
代码
import numpy as np
import matplotlib.pyplot as plt
from vtkmodules.numpy_interface.algorithms import ln

# 0 设置字体
plt.rc('font',family='Times New Roman', size=15)

# 1.1 定义sigmoid函数
def sigmoid(x):
    return 1. / (1 + np.exp(-x))
# 1.2 定义tanh函数
def tanh(x):
    return (np.exp(x) - np.exp(-x)) / (np.exp(x) + np.exp(-x))
# 1.3 定义relu函数
def relu(x):
    return np.where(x < 0, 0, x)
# 1.4 定义prelu函数
def Leaky_ReLU(x):
    return np.where(x<0, x * 0.5, x)
def Mish(x):
    return x * tanh(ln(1. + np.exp(x)))

# 2.1 定义绘制函数sigmoid函数
def plot_sigmoid(fig):
    x = np.arange(-10, 10, 0.1)
    y = sigmoid(x)
    # fig = plt.figure()
    ax = fig.add_subplot(231)
    ax.spines['top'].set_color('none')
    ax.spines['right'].set_color('none')
    ax.spines['left'].set_position(('data', 0))
    ax.plot(x, y,color="black", lw=3)
    plt.xticks(fontsize=15)
    plt.yticks(fontsize=15)
    plt.xlim([-10.05, 10.05])
    plt.ylim([-0.02, 1.02])
    plt.tight_layout()
    # plt.show()
# 2.2 定义绘制函数tanh函数
def plot_tanh(fig):
    x = np.arange(-10, 10, 0.1)
    y = tanh(x)
    # fig = plt.figure()
    ax = fig.add_subplot(232)
    ax.spines['top'].set_color('none')
    ax.spines['right'].set_color('none')
    ax.spines['left'].set_position(('data', 0))
    ax.spines['bottom'].set_position(('data', 0))
    ax.plot(x, y, color="black", lw=3)
    plt.xticks(fontsize=15)
    plt.yticks(fontsize=15)
    plt.xlim([-10.05, 10.05])
    plt.ylim([-0.02, 1.02])
    ax.set_yticks([-1.0, -0.5, 0.5, 1.0])
    ax.set_xticks([-10, -5, 5, 10])
    plt.tight_layout()
    # plt.show()
# 2.3 定义绘制函数relu函数
def plot_relu(fig):
    x = np.arange(-10, 10, 0.1)
    y = relu(x)
    # fig = plt.figure()
    ax = fig.add_subplot(233)
    ax.spines['top'].set_color('none')
    ax.spines['right'].set_color('none')
    ax.spines['left'].set_position(('data', 0))
    ax.plot(x, y, color="black", lw=3)
    plt.xticks(fontsize=15)
    plt.yticks(fontsize=15)
    plt.xlim([-10.05, 10.05])
    plt.ylim([-0.02, 1.02])
    ax.set_yticks([2, 4, 6, 8, 10])
    plt.tight_layout()
    # plt.show()
# 2.4 定义绘制函数prelu函数
def plot_Leaky_ReLU(fig):
    x = np.arange(-10, 10, 0.1)
    y = Leaky_ReLU(x)
    # fig = plt.figure()
    ax = fig.add_subplot(234)
    ax.spines['top'].set_color('none')
    ax.spines['right'].set_color('none')
    ax.spines['left'].set_position(('data', 0))
    ax.spines['bottom'].set_position(('data', 0))
    ax.plot(x, y, color="black", lw=3)
    plt.xticks(fontsize=15)
    plt.yticks(fontsize=15)
    plt.tight_layout()
    # plt.show()
def plot_Mish(fig):
    x = np.arange(-10, 10, 0.1)
    y = Mish(x)
    #fig = plt.figure()
    ax = fig.add_subplot(235)
    ax.spines['top'].set_color('none')
    ax.spines['right'].set_color('none')
    ax.spines['left'].set_position(('data', 0))
    ax.spines['bottom'].set_position(('data', 0))
    ax.plot(x, y, color="black", lw=3)
    plt.xticks(fontsize=15)
    plt.yticks(fontsize=15)
    plt.tight_layout()
    plt.show()

# 3 运行程序
fig = plt.figure()
plot_sigmoid(fig)
plot_tanh(fig)
plot_relu(fig)
plot_Leaky_ReLU(fig)
plot_Mish(fig)
绘制结果