Python中的图像处理(第八章)Python直方图统计(3)
Python中的图像处理(第八章)Python直方图统计(3)
- 前言
- 一. Python准备
- 二. Python仿真
- 三. 小结
前言
随着人工智能研究的不断兴起,Python的应用也在不断上升,由于Python语言的简洁性、易读性以及可扩展性,特别是在开源工具和深度学习方向中各种神经网络的应用,使得Python已经成为最受欢迎的程序设计语言之一。由于完全开源,加上简单易学、易读、易维护、以及其可移植性、解释性、可扩展性、可扩充性、可嵌入性:丰富的库等等,自己在学习与工作中也时常接触到Python,这个系列文章的话主要就是介绍一些在Python中常用一些例程进行仿真演示!
本系列文章主要参考杨秀章老师分享的代码资源,杨老师博客主页是Eastmount,杨老师兴趣广泛,不愧是令人膜拜的大佬,他过成了我理想中的样子,希望以后有机会可以向他请教学习交流。
因为自己是做图像语音出身的,所以结合《Python中的图像处理》,学习一下Python,OpenCV已经在Python上进行了多个版本的维护,所以相比VS,Python的环境配置相对简单,缺什么库直接安装即可。本系列文章例程都是基于Python3.8的环境下进行,所以大家在进行借鉴的时候建议最好在3.8.0版本以上进行仿真。本文继续来对本书第八章的最后5个例程进行介绍。
一. Python准备
如何确定自己安装好了python
win+R输入cmd进入命令行程序
![]()
点击“确定”
![]()
输入:python,回车
![]()
看到Python相关的版本信息,说明Python安装成功。
二. Python仿真
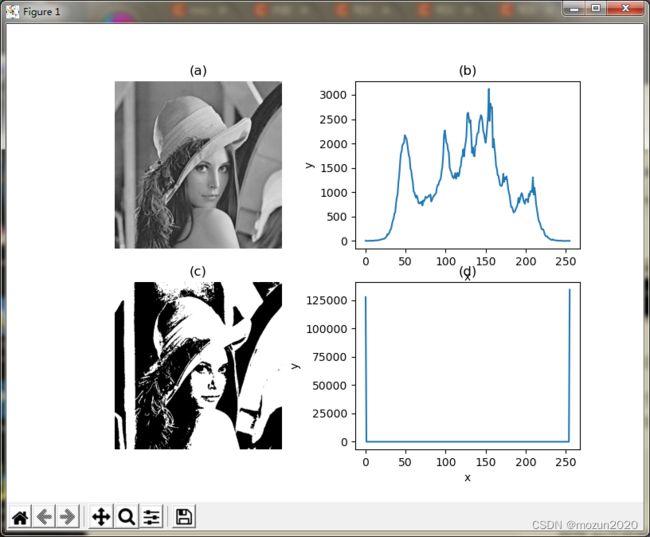
(1)新建一个chapter08_11.py文件,输入以下代码,图片也放在与.py文件同级文件夹下
#coding:utf-8
#By:Eastmount CSDN 2021-02-05
import cv2
import numpy as np
import matplotlib.pyplot as plt

#读取图像
img = cv2.imread('lena.bmp')

#图像灰度转换
grayImage = cv2.cvtColor(img, cv2.COLOR_BGR2GRAY)

#二进制阈值化处理
r, result = cv2.threshold(grayImage, 127, 255, cv2.THRESH_BINARY)

#计算原图的直方图
hist = cv2.calcHist([img], [0], None, [256], [0,256])

#计算阈值化处理的直方图
hist_res = cv2.calcHist([result], [0], None, [256], [0,256])

#原始图像
plt.figure(figsize=(8, 6))
plt.subplot(221), plt.imshow(img, 'gray'), plt.title("(a)"), plt.axis('off')

#绘制原始图像直方图
plt.subplot(222), plt.plot(hist), plt.title("(b)"), plt.xlabel("x"), plt.ylabel("y")

#阈值化处理后的图像
plt.subplot(223), plt.imshow(result, 'gray'), plt.title("(c)"), plt.axis('off')

#阈值化处理图像的直方图
plt.subplot(224), plt.plot(hist_res), plt.title("(d)"), plt.xlabel("x"), plt.ylabel("y")
plt.show()
保存.py文件
输入eixt()退出python,输入命令行进入工程文件目录
![]()
输入以下命令,跑起工程
python chapter08_11.py
(2)新建一个chapter08_12.py文件,输入以下代码,图片也放在与.py文件同级文件夹下
#coding:utf-8
#By:Eastmount CSDN 2021-02-05
import cv2
import numpy as np
import matplotlib.pyplot as plt

#读取图像
img = cv2.imread('Lena.png')

#转换为RGB图像
img_rgb = cv2.cvtColor(img, cv2.COLOR_BGR2RGB)

#图像HSV转换
hsv = cv2.cvtColor(img,cv2.COLOR_BGR2HSV)

#计算H-S直方图
hist = cv2.calcHist(hsv, [0,1], None, [180,256], [0,180,0,256])

#原始图像
plt.figure(figsize=(8, 6))
plt.subplot(121), plt.imshow(img_rgb, 'gray'), plt.title("(a)"), plt.axis('off')

#绘制H-S直方图
plt.subplot(122), plt.imshow(hist, interpolation='nearest'), plt.title("(b)")
plt.xlabel("x"), plt.ylabel("y")
plt.show()
保存.py文件输入以下命令,跑起工程
python chapter08_12.py
(3)新建一个chapter08_13.py文件,输入以下代码,图片也放在与.py文件同级文件夹下
#coding:utf-8
#By:Eastmount CSDN 2021-02-05
import cv2
import numpy as np
import matplotlib.pyplot as plt

#函数: 获取图像的灰度平均值
def fun_mean(img, height, width):
    sum_img = 0
    for i in range(height):
        for j in range(width):
            sum_img = sum_img + int(img[i,j])
    mean = sum_img / (height * width)
    return mean

#函数: 获取中位数
def fun_median(data):
    length = len(data)
    data.sort()
    if (length % 2)== 1:
        z = length // 2
        y = data[z]
    else:
        y = (int(data[length//2]) + int(data[length//2-1])) / 2
    return y

#读取图像
img = cv2.imread('lena.bmp')

#图像灰度转换
grayImage = cv2.cvtColor(img, cv2.COLOR_BGR2GRAY)

#获取图像高度和宽度
height = grayImage.shape[0]
width = grayImage.shape[1]

#计算图像的灰度平均值
mean = fun_mean(grayImage, height, width)
print("灰度平均值:", mean)

#计算图像的灰度中位数
value = grayImage.ravel() #获取所有像素值
median = fun_median(value)
print("灰度中值:", median)

#计算图像的灰度标准差
std = np.std(value, ddof = 1)
print("灰度标准差", std)
保存.py文件输入以下命令,跑起工程
python chapter08_13.py
没有报错,直接打印各项灰度数据运行成功!
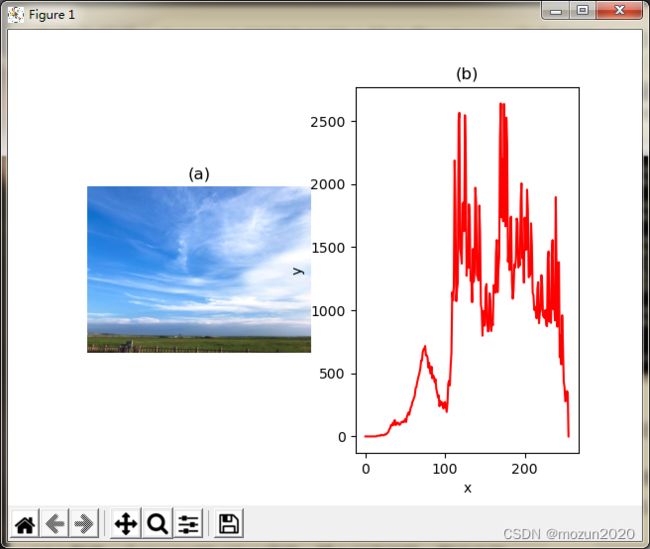
(4)新建一个chapter08_14.py文件,输入以下代码,图片也放在与.py文件同级文件夹下
#encoding:utf-8
#By:Eastmount CSDN 2021-02-05
import cv2
import numpy as np
import matplotlib.pyplot as plt

#函数: 判断黑夜或白天
def func_judge(img):
    #获取图像高度和宽度
    height = grayImage.shape[0]
    width = grayImage.shape[1]
    piexs_sum = height * width
    dark_sum = 0  #偏暗像素个数
    dark_prop = 0 #偏暗像素所占比例

    for i in range(height):
        for j in range(width):
            if img[i, j] < 50: #阈值为50
                dark_sum += 1

    #计算比例
    print(dark_sum)
    print(piexs_sum)
    dark_prop = dark_sum * 1.0 / piexs_sum
    if dark_prop >=0.8:
        print("This picture is dark!", dark_prop)
    else:
        print("This picture is bright!", dark_prop)

#读取图像
img = cv2.imread('day.png')

#转换为RGB图像
img_rgb = cv2.cvtColor(img, cv2.COLOR_BGR2RGB)

#图像灰度转换
grayImage = cv2.cvtColor(img, cv2.COLOR_BGR2GRAY)

#计算256灰度级的图像直方图
hist = cv2.calcHist([grayImage], [0], None, [256], [0,255])

#判断黑夜或白天
func_judge(grayImage)

#显示原始图像和绘制的直方图
plt.subplot(121), plt.imshow(img_rgb, 'gray'), plt.axis('off'), plt.title("(a)")
plt.subplot(122), plt.plot(hist, color='r'), plt.xlabel("x"), plt.ylabel("y"), plt.title("(b)")
plt.show()
保存.py文件输入以下命令,跑起工程
python chapter08_14.py
(5)新建一个chapter08_15.py文件,输入以下代码,图片也放在与.py文件同级文件夹下
# -*- coding: utf-8 -*-
import numpy as np
import cv2 as cv
import matplotlib.pyplot as plt
from mpl_toolkits.mplot3d import Axes3D
from matplotlib import cm
from matplotlib.ticker import LinearLocator, FormatStrFormatter

#读取图像
img = cv.imread("yxz.png")
img = cv.cvtColor(img,cv.COLOR_BGR2GRAY)
imgd = np.array(img)      #image类转numpy

#准备数据
sp = img.shape
h = int(sp[0])        #图像高度(rows)
w = int(sp[1])        #图像宽度(colums) of image

#绘图初始处理
fig = plt.figure(figsize=(16,12))
ax = fig.gca(projection="3d")

x = np.arange(0, w, 1)
y = np.arange(0, h, 1)
x, y = np.meshgrid(x,y)
z = imgd
surf = ax.plot_surface(x, y, z, cmap=cm.coolwarm)

#自定义z轴
ax.set_zlim(-10, 255)
ax.zaxis.set_major_locator(LinearLocator(10))   #设置z轴网格线的疏密
#将z的value字符串转为float并保留2位小数
ax.zaxis.set_major_formatter(FormatStrFormatter('%.02f'))

# 设置坐标轴的label和标题
ax.set_xlabel('x', size=15)
ax.set_ylabel('y', size=15)
ax.set_zlabel('z', size=15)
ax.set_title("surface plot", weight='bold', size=20)

#添加右侧的色卡条
fig.colorbar(surf, shrink=0.6, aspect=8)
plt.show()
保存.py文件输入以下命令,跑起工程
python chapter08_15.py
三. 小结
本文主要介绍在Python中调用OpenCV库对图像进行阈值处理,颜色空间转换,灰度参数转换与计算,像素统计判断,三维图像显示等操作。由于本书的介绍比较系统全面,所以会出一个系列文章进行全系列仿真实现,感兴趣的还是建议去原书第八章深入学习理解,下一篇文章将继续介绍第九章节的5例仿真实例。每天学一个Python小知识,大家一起来学习进步阿!
本系列示例主要参考杨老师GitHub源码,安利一下地址:ImageProcessing-Python(喜欢记得给个star哈!)


