多项式回归
多项式回归
文章目录
- 多项式回归
-
- 一、多项式回归
- 二、scikit-learn中的多项式回归
- 三、关于PolynomialFeatures
- 四、sklearn中的Pipeline
- 五、过拟合和欠拟合
- 六、解决过拟合问题
- 七、透过学习曲线看过拟合
- 我是尾巴
直线回归研究的是一个依变量与一个自变量之间的回归问题。
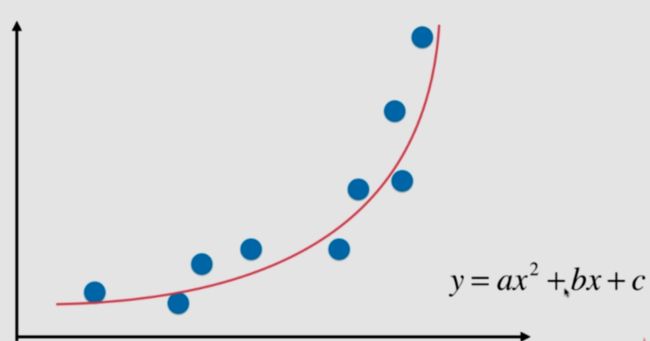
研究一个因变量与一个或多个自变量间多项式的回归分析方法,称为多项式回归(Polynomial Regression)多项式回归模型是线性回归模型的一种。
多项式回归问题可以通过变量转换化为多元线性回归问题来解决。
一、多项式回归
import numpy as np
import matplotlib.pyplot as plt

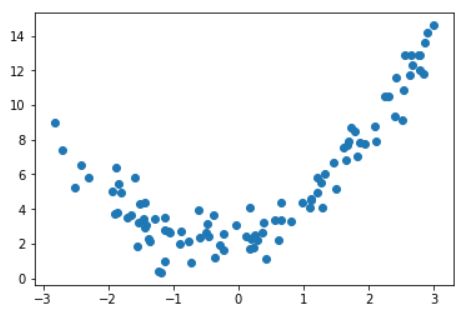
x = np.random.uniform(-3, 3, size=100)
X = x.reshape(-1, 1)
y = 0.5 + x**2 + x + 2 + np.random.normal(0, 1, size=100)
plt.scatter(x, y)
plt.show()
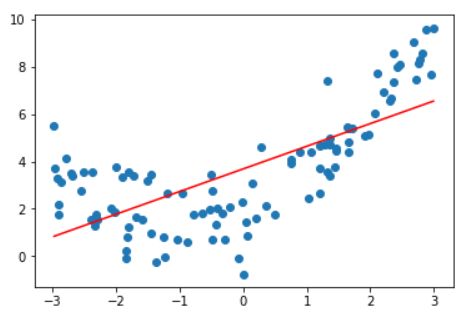
如果直接使用线性回归,看一下效果:
from sklearn.linear_model import LinearRegression

lin_reg = LinearRegression()
lin_reg.fit(X, y)
y_predict = lin_reg.predict(X)
plt.scatter(x, y)
plt.plot(x, y_predict, color='r')
plt.show()
很显然,拟合效果并不好。那么解决呢?
解决方案:添加一个特征。
(X**2).shape
X2 = np.hstack([X, X**2])
X2.shape
lin_reg2 = LinearRegression()
lin_reg2.fit(X2, y)
y_predict2 = lin_reg2.predict(X2)
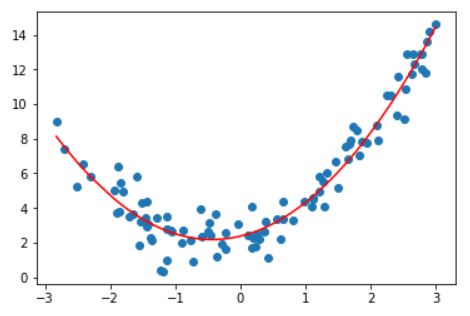
plt.scatter(x, y)
plt.plot(np.sort(x), y_predict2[np.argsort(x)], color='r')
plt.show()
这样就比直线拟合要好很多。
lin_reg2.coef_
# array([0.90802935, 1.04112467])
lin_reg2.intercept_
# 2.3783560083768602
小结:多项式回归在算法并没有什么新的地方,完全是使用线性回归的思路,关键在于为数据添加新的特征,而这些新的特征是原有的特征的多项式组合,采用这样的方式就能解决非线性问题,这样的思路跟PCA这种降维思想刚好相反,而多项式回归则是升维,添加了新的特征之后,使得更好地拟合高维数据。
二、scikit-learn中的多项式回归
首先生成虚拟数据:
import numpy as np
import matplotlib.pyplot as plt

x = np.random.uniform(-3, 3, size=100)
X = x.reshape(-1, 1)
y = 0.5 + x**2 + x + 2 + np.random.normal(0, 1, size=100)
# 多项式回归其实对数据进行预处理,给数据添加新的特征,所以调用的库在preprocessing中
from sklearn.preprocessing import PolynomialFeatures

# 这个degree表示我们使用多少次幂的多项式
poly = PolynomialFeatures(degree=2)
poly.fit(X)
X2 = poly.transform(X)
X2.shape
输出结果:(100, 3) 第一列常数项,第二列一次项系数,第三列二次项系数,接下来查看一下前五列
# 取出前五列
X2[:5, :]
array([[ 1.        , -1.45344304,  2.11249668],
       [ 1.        , -1.87779517,  3.5261147 ],
       [ 1.        ,  2.30882492,  5.33067251],
       [ 1.        ,  1.78648616,  3.19153281],
       [ 1.        ,  2.9064929 ,  8.447701  ]])
from sklearn.linear_model import LinearRegression

reg = LinearRegression()
reg.fit(X2, y)
y_predict = reg.predict(X2)
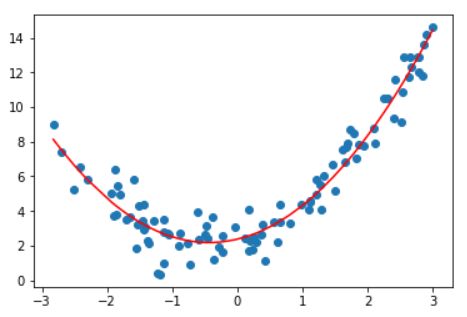
plt.scatter(x, y)
plt.plot(np.sort(x), y_predict2[np.argsort(x)], color='r')
plt.show()
reg.coef_
# array([0.        , 0.90802935, 1.04112467])
reg.intercept_
# 2.3783560083768616
三、关于PolynomialFeatures
在多项式回归中的关键在于如何构建新的特征,在sklearn中已经封装了,那具体如何实现的?
之前使用的都是1维数据,如果使用2维3维甚至更高维呢?
import numpy as np

x = np.arange(1, 11).reshape(5, 2)
x.shape
# (5, 2)
x
输出结果:
array([[ 1,  2],
       [ 3,  4],
       [ 5,  6],
       [ 7,  8],
       [ 9, 10]])
from sklearn.preprocessing import PolynomialFeatures

poly = PolynomialFeatures()
poly.fit(x)
x2 = poly.transform(x)
x2.shape
# (5, 6)
x2
array([[  1.,   1.,   2.,   1.,   2.,   4.],
       [  1.,   3.,   4.,   9.,  12.,  16.],
       [  1.,   5.,   6.,  25.,  30.,  36.],
       [  1.,   7.,   8.,  49.,  56.,  64.],
       [  1.,   9.,  10.,  81.,  90., 100.]])
此时,可以看出当数据维度是2维是,经过多项式预处理生成了6维数据,第一列很显然是0次项系数,第二列和第三列也很好理解,分别是x1,x2,第四列和第六列分别是x1[2]和x2[2],还有一列,其实是x1*x2,这就是第5列,总共6列。由此可以猜想一下如果数据是3维的时候是什么情况?
poly = PolynomialFeatures(degree=3)
poly.fit(x)
x3 = poly.transform(x)
x3.shape
# (5, 10)
array([[   1.,    1.,    2.,    1.,    2.,    4.,    1.,    2.,    4.,
           8.],
       [   1.,    3.,    4.,    9.,   12.,   16.,   27.,   36.,   48.,
          64.],
       [   1.,    5.,    6.,   25.,   30.,   36.,  125.,  150.,  180.,
         216.],
       [   1.,    7.,    8.,   49.,   56.,   64.,  343.,  392.,  448.,
         512.],
       [   1.,    9.,   10.,   81.,   90.,  100.,  729.,  810.,  900.,
        1000.]])
那么这10列,分别对应着什么?通过PolynomiaFeatures,将所有的可能组合,升维的方式呈指数型增长。这也会带来一定的问题。 如何解决这种爆炸式的增长?如果不控制一下,试想x和x[^100]相比差异就太大了。这就是传说中的过拟合。
四、sklearn中的Pipeline
一般情况下,我们会对数据进行归一化,然后进行多项式升维,再接着进行线性回归。因为sklearn中并没有对多项式回归进行封装,不过可以使用Pipeline对这些操作进行整合。
import numpy as np
import matplotlib.pyplot as plt

x = np.random.uniform(-3, 3, size=100)
X = x.reshape(-1, 1)
y = 0.5 * x**2 + 2 + np.random.normal(0, 1, size=100)

from sklearn.pipeline import Pipeline
from sklearn.preprocessing import PolynomialFeatures
from sklearn.linear_model import LinearRegression
from sklearn.preprocessing import StandardScaler

poly_reg = Pipeline([
    ('poly', PolynomialFeatures(degree=2)),
    ('std_scale', StandardScaler()),
    ('lin_reg', LinearRegression())
])
poly_reg.fit(X, y)
y_predict = poly_reg.predict(X)

plt.scatter(x, y)
plt.plot(np.sort(x), y_predict[np.argsort(x)], color='r')
plt.show()
五、过拟合和欠拟合
多项式回归的最大优点就是可以通过增加x的高次项对实测点进行逼近,直至满意为止。但是这也正是它最大的缺点,因为通常情况下试过过高的维度对数据进行拟合,在训练集上会有很好的表现,但是测试集可能就不那么理想了,这也正是解决过拟合的一种办法。
import numpy as np
import matplotlib.pyplot as plt

np.random.seed(666)
np.random.seed(666)
x = np.random.uniform(-3.0, 3.0, size=100)
X = x.reshape(-1, 1)
y = 0.5 * x**2 + x + 2 + np.random.normal(0, 1, size=100)
plt.scatter(x, y)
plt.show()
生成这种数据集之后,使用不同的拟合方式,并使用均方误差来对比几种拟合的效果。
- 线性拟合
from sklearn.linear_model import LinearRegression

lin_reg = LinearRegression()
lin_reg.fit(X, y)
lin_reg.score(X, y)
# 0.4953707811865009
y_predict = lin_reg.predict(X)
plt.scatter(x, y)
plt.plot(np.sort(x), y_predict[np.argsort(x)], color='r')
plt.show()
from sklearn.metrics import mean_squared_error

y_predict = lin_reg.predict(X)
mean_squared_error(y, y_predict)
# 3.0750025765636577
显然,直接使用简单的一次线性回归,拟合的结果就是欠拟合(underfiting)
- 使用二次多项式回归
from sklearn.pipeline import Pipeline
from sklearn.preprocessing import PolynomialFeatures
from sklearn.linear_model import LinearRegression
from sklearn.preprocessing import StandardScaler

def PolynomialRegression(degree):
    return Pipeline([
        ('poly', PolynomialFeatures(degree=degree)),
        ('std_scale', StandardScaler()),
        ('lin_reg', LinearRegression())
    ])

poly_reg = PolynomialRegression(degree=2)
poly_reg.fit(X, y)
Pipeline(memory=None,
     steps=[('poly', PolynomialFeatures(degree=2, include_bias=True, interaction_only=False)), ('std_scale', StandardScaler(copy=True, with_mean=True, with_std=True)), ('lin_reg', LinearRegression(copy_X=True, fit_intercept=True, n_jobs=None,
         normalize=False))])
y_predict = poly_reg.predict(X)
mean_squared_error(y, y_predict)
# 1.0987392142417856
plt.scatter(x, y)
plt.plot(np.sort(x), y_predict[np.argsort(x)], color='r')
plt.show()
- 使用十次多项式回归
poly10_reg = PolynomialRegression(degree=10)
poly10_reg.fit(X, y)

y10_predict = poly10_reg.predict(X)
mean_squared_error(y, y10_predict)
# 1.0508466763764164
- 使用一百次多项式回归
poly100_reg = PolynomialRegression(degree=100)
poly100_reg.fit(X, y)

y100_predict = poly100_reg.predict(X)
mean_squared_error(y, y100_predict)
# 0.687293250556113
plt.scatter(x, y)
plt.plot(np.sort(x), y100_predict[np.argsort(x)], color='r')
plt.show()
x_plot = np.linspace(-3, 3, 100).reshape(100, 1)
y_plot = poly100_reg.predict(x_plot)

plt.scatter(x, y)
plt.plot(x_plot[:,0], y_plot, color='r')
plt.show()
x_plot = np.linspace(-3, 3, 100).reshape(100, 1)
y_plot = poly100_reg.predict(x_plot)

plt.scatter(x, y)
plt.plot(x_plot[:,0], y_plot, color='r')
plt.axis([-3, 3, -1, 10])
plt.show()
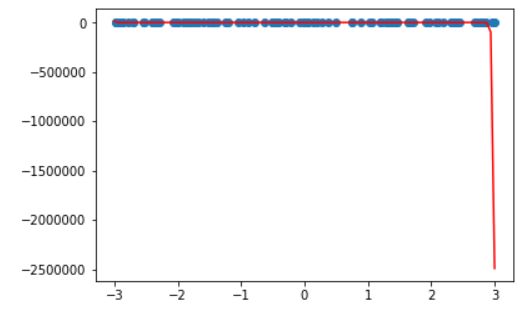
虽然它穿过了更多的点,但是我们会发现大于3的时候取值基本都在-25万,这显然是不合适的,而且当把坐标轴取值缩小以后也可以发现,震荡比较厉害,此时,这就叫过拟合(overfiting)。
六、解决过拟合问题
通常在机器学习的过程中,主要解决的都是过拟合问题,因为这牵涉到模型的泛化能力。所谓泛化能力,就是模型在验证训练集之外的数据时能够给出很好的解答。只是对训练集的数据拟合的有多好是没有意义的,我们需要的模型的泛化能力有多好。
为什么要训练数据集与测试数据集?
通常情况下我们会将数据集分为训练集和测试集,通过训练数据训练出来的模型如果能对测试集具有较好的表现,才有意义。
from sklearn.model_selection import train_test_split
import numpy as np
import matplotlib.pyplot as plt

np.random.seed(666)
np.random.seed(666)
x = np.random.uniform(-3.0, 3.0, size=100)
X = x.reshape(-1, 1)
y = 0.5 * x**2 + x + 2 + np.random.normal(0, 1, size=100)

x_train, x_test, y_train, y_test = train_test_split(X, y, random_state=666)
lin_reg = LinearRegression()
lin_reg.fit(x_train, y_train)
y_predict = lin_reg.predict(x_test)
mean_squared_error(y_test, y_predict)
输出结果:2.2199965269396573
from sklearn.pipeline import Pipeline
from sklearn.preprocessing import PolynomialFeatures
from sklearn.linear_model import LinearRegression
from sklearn.preprocessing import StandardScaler

def PolynomialRegression(degree):
    return Pipeline([
        ('poly', PolynomialFeatures(degree=degree)),
        ('std_scale', StandardScaler()),
        ('lin_reg', LinearRegression())
    ])
poly2_reg = PolynomialRegression(degree=2)
poly2_reg.fit(x_train, y_train)
y2_predict = poly2_reg.predict(x_test)
mean_squared_error(y_test, y2_predict)
输出结果: 0.8035641056297901
poly10_reg = PolynomialRegression(degree=10)
poly10_reg.fit(x_train, y_train)
y10_predict = poly10_reg.predict(x_test)
mean_squared_error(y_test, y10_predict)
输出结果:0.9212930722150781
通过上面的例子可以发现,当degree=2的时候在测试集上的均方误差和直线拟合相比好了很多,但是当degree=10的时候再测试集上的均方误差相对degree=2的时候效果差了很多,这就说名训练出来的模型已经过拟合了。
poly100_reg = PolynomialRegression(degree=100)
poly100_reg.fit(x_train, y_train)
y100_predict = poly100_reg.predict(x_test)
mean_squared_error(y_test, y100_predict)
输出结果:14440175276.314638
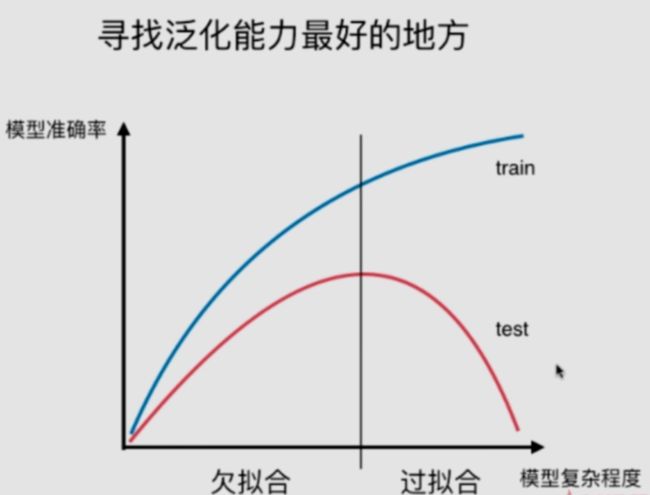
小结:对于模型复杂度与模型准确率中寻找泛化能力最好的地方。
欠拟合:underfitting,算法所训练的模型不能完整表述数据关系。
过拟合:overfitting,算法所训练的模型过多地表达数据间的噪音关系。
七、透过学习曲线看过拟合
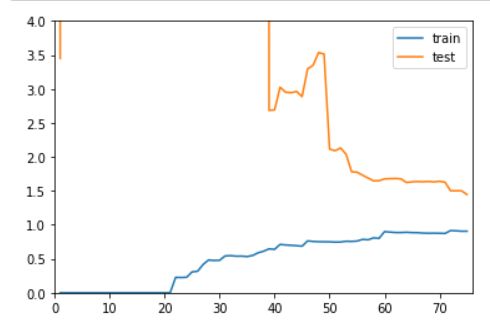
学习曲线描述的就是,随着训练样本的逐渐增多,算法训练出的模型的表现能力。
首先我们用一个简单的例子看一下如何绘制学习曲线:
from sklearn.model_selection import train_test_split
import numpy as np
import matplotlib.pyplot as plt

np.random.seed(666)
np.random.seed(666)
x = np.random.uniform(-3.0, 3.0, size=100)
X = x.reshape(-1, 1)
y = 0.5 * x**2 + x + 2 + np.random.normal(0, 1, size=100)

x_train, x_test, y_train, y_test = train_test_split(X, y, random_state=10)
x_train.shape
输出结果:(75, 1)
from sklearn.linear_model import LinearRegression
from sklearn.metrics import mean_squared_error

train_score = []
test_score = []
for i in range(1, 76):
    lin_reg = LinearRegression()
    lin_reg.fit(x_train[:i], y_train[:i])

    y_train_predict = lin_reg.predict(x_train[:i])
    train_score.append(mean_squared_error(y_train[:i], y_train_predict))

    y_test_predict = lin_reg.predict(x_test)
    test_score.append(mean_squared_error(y_test, y_test_predict))

plt.plot([i for i in range(1, 76)], np.sqrt(train_score), label='train')
plt.plot([i for i in range(1, 76)], np.sqrt(test_score), label='test')
plt.legend()
plt.show()
下面绘制学习曲线的函数封装一下,方便后面调用。
def plot_learning_curve(algo, x_train, x_test, y_train, y_test):

    train_score = []
    test_score = []
    for i in range(1, len(x_train)+1):
        algo.fit(x_train[:i], y_train[:i])

        y_train_predict = algo.predict(x_train[:i])
        train_score.append(mean_squared_error(y_train[:i], y_train_predict))

        y_test_predict = algo.predict(x_test)
        test_score.append(mean_squared_error(y_test, y_test_predict))

    plt.plot([i for i in range(1, len(x_train)+1)], np.sqrt(train_score), label='train')
    plt.plot([i for i in range(1, len(x_train)+1)], np.sqrt(test_score), label='test')
    plt.legend()
    # plt.axis([0, len(x_train)+1, 0, 4])
    plt.show()
plot_learning_curve(LinearRegression(), x_train, x_test, y_train, y_test)
接下来使用多项式回归绘制学习曲线:
from sklearn.pipeline import Pipeline
from sklearn.preprocessing import PolynomialFeatures
from sklearn.linear_model import LinearRegression
from sklearn.preprocessing import StandardScaler

def PolynomialRegression(degree):
    return Pipeline([
        ('poly', PolynomialFeatures(degree=degree)),
        ('std_scale', StandardScaler()),
        ('lin_reg', LinearRegression())
    ])
poly2_reg = PolynomialRegression(degree=2)
plot_learning_curve(poly2_reg, x_train, x_test, y_train, y_test)
poly2_reg = PolynomialRegression(degree=20)
plot_learning_curve(poly2_reg, x_train, x_test, y_train, y_test)
以上三幅图分别对应着欠拟合,最佳,过拟合。
我是尾巴
在机器学习过程中,经常会出现过拟合的情况,具体关于过拟合的解决办法有很多,接下来会继续学习。
本次推荐:
鸠摩搜索,一个文档搜索引擎
毒鸡汤:竹子用了4年的时间, 仅仅长了3cm, 在第5年开始,却以每天30cm的速度疯狂生长, 仅仅用了6周的时间就长到了15米。
其实,在前面的4年, 竹子把根放土壤里延伸了数百平米。做人做事亦是如此,不必担心你此时此刻的付出得不到回报, 因为这些付出都是为了扎根,厚积薄发。
所以,不要浮躁,每天做好自己,努力扎根,努力成长,不要轻言放弃,总有一天,你会发现原来自己是个土豆。
继续加油!
