文章目录
- 一、结果预示
- 二、绘制过程
-
- 2.1 导入相关库
- 2.2 导入数据
- 2.3 绘制气泡图
-
- 2.3.1 二维气泡
- 2.3.2 三维气泡
- 2.3.4 四维气泡
一、结果预示
- x:销售金额
- y:单店日均产出
- size:门店数量
- 颜色:区分大区

二、绘制过程
2.1 导入相关库
import random
import pandas as pd
import seaborn as sns
import matplotlib.pyplot as plt
from matplotlib.font_manager import FontProperties
myfont=FontProperties(fname=r'C:\Windows\Fonts\simhei.ttf',size=14)
sns.set(font=myfont.get_name())
2.2 导入数据
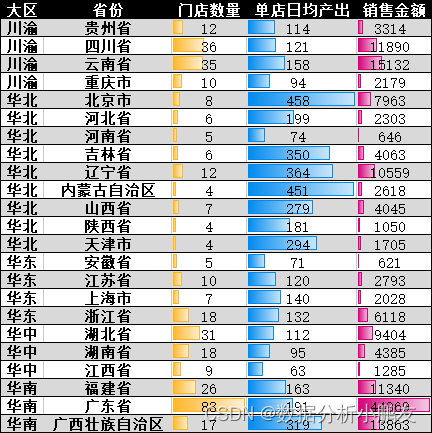
data = pd.read_excel("data_气泡图.xlsx")

2.3 绘制气泡图
2.3.1 二维气泡
plt.figure(
figsize = (16,8),
dpi = 100
)
plt.scatter(
x = data['销售金额'],
y = data['单店日均产出'],
)

2.3.2 三维气泡
- x:销售金额
- y:单店日均产出
- size:门店数量
plt.figure(
figsize = (16,8),
dpi = 100
)
plt.scatter(
x = data['销售金额'],
y = data['单店日均产出'],
s = data['门店数量']*100
)

2.3.4 四维气泡
- x:销售金额
- y:单店日均产出
- size:门店数量
- 颜色:区分大区
def Randomcolor():
'''
生成随机颜色编码
'''
colorArr = ['1','2','3','4','5','6','7','8','9','A','B','C','D','E','F']
color = ""
for i in range(6):
color += colorArr[random.randint(0,14)]
return "#"+color
def Scatter(df,x_name,y_name,size_name,legend_name,marker_name):
'''
绘制四维气泡图
输入 -- df: DataFrame
x_name: 横轴列
y_name: 纵轴列
size_name: 规格大小列
legend_name: 图例名称列
marker_name: 数据标签列
'''
plt.scatter(
x = df[x_name],
y = df[y_name],
s = df[size_name]*100,
color = Randomcolor(),
label = df[legend_name].unique().tolist()[0],
)
for x, y, m in zip(df[x_name], df[y_name], df[marker_name]):
plt.text(x, y, m, ha='center', va='bottom')
plt.figure(
figsize = (16,8),
dpi = 100
)
data.groupby(['大区']).apply(Scatter,"销售金额","单店日均产出","门店数量","大区","省份")
plt.xlabel('销售金额')
plt.ylabel('单店日均产出')
plt.title('四维气泡图示例',size=25)
plt.legend(
fontsize=15,
frameon=True,
shadow=True,
labelspacing=1,
markerscale=0.5,
)
plt.show()


