python线性回归实例_线性回归的几个例子
线性回归的概念:
给定数据集D = {(x1, y1), (x2, y2)........(xm, ym)},向量x和结果y均属于实数空间R。“线性回归”试图学得一个线性模型以尽可能准确的预测实值进行标记。
其数学表达式如下图所示:
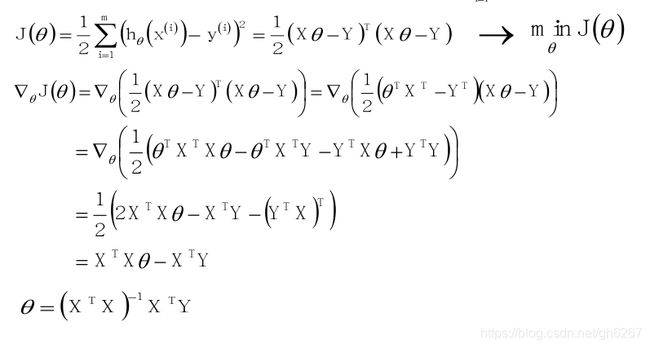
再定义损失函数:
其中h(x)为预测值,y为真实值
现在就是要找到一个θ使得J(θ)的值最小
(1)标准公式法:
然而实际情况下
![]()
![]() 往往不满秩,为了解决这个问题,常见的做法是引入正则项。
往往不满秩,为了解决这个问题,常见的做法是引入正则项。
即:
下面的例子是用线性回归预测波士顿的房价:
import numpy as np
import pandas as pd
import matplotlib.pyplot as plt
from sklearn.linear_model import LinearRegression, LassoCV, RidgeCV, ElasticNetCV
from sklearn.model_selection import train_test_split
from sklearn.preprocessing import StandardScaler
def notEmpty(s):
return s != ''
df = pd.read_csv('../datas/housing.data', header=None)
datas = np.empty((len(df), 14))
for i, d in enumerate(df.values):
d = list(map(float, filter(notEmpty, d[0].split(' '))))
datas[i] = np.array(d)
x, y = np.split(datas, (13, ), axis=1)
ss = StandardScaler()
x_train, x_test, y_train, y_test = train_test_split(x, y, test_size=0.2, random_state=0)
x_train = ss.fit_transform(x_train)
x_test = ss.transform(x_test)
model = LinearRegression()
model.fit(x_train, y_train)
print(model.score(x_train, y_train))
print(model.score(x_test, y_test))
ln_x_test = range(len(x_test))
y_predict = model.predict(x_test)
plt.plot(ln_x_test, y_predict, 'g-', lw=2)
plt.plot(ln_x_test, y_test, 'r-', lw = 2)
plt.show()
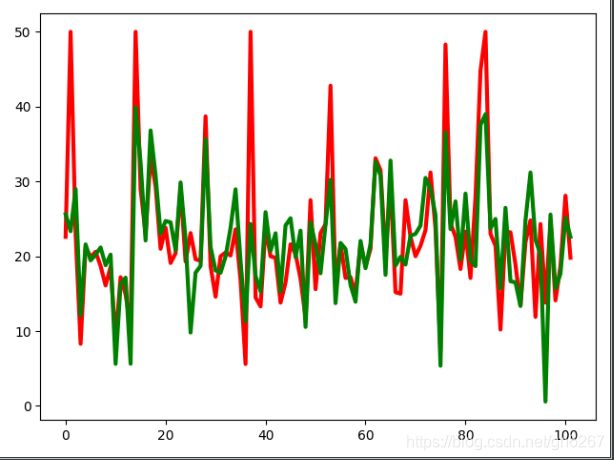
结果如下图所示:
为了防止数据过拟合我们可以加入正则项
如下图所示:
使用L2正则的线性回归模型就称为Ridge回归(岭回归)
使用L1正则的线性回归模型就称为LASSO回归(Least Absolute Shrinkage and Selection Operator)
Ridge(L1-norm)和LASSO(L2-norm)比较
L2-norm中,由于对于各个维度的参数缩放是在一个圆内缩放的,不可能导致
有维度参数变为0的情况,那么也就不会产生稀疏解;实际应用中,数据的维度
中是存在噪音和冗余的,稀疏的解可以找到有用的维度并且减少冗余,提高回归
预测的准确性和鲁棒性(减少了overfitting)(L2-norm可以达到最终解的稀疏性的要求)
Ridge模型具有较高的准确性、鲁棒性以及稳定性;LASSO模型具有较高的求解
速度。
四种回归的对比代码如下:
import numpy as np
import matplotlib as mpl
import matplotlib.pyplot as plt
import pandas as pd
import warnings
import sklearn
from sklearn.linear_model import LinearRegression, LassoCV, RidgeCV, ElasticNetCV
from sklearn.preprocessing import PolynomialFeatures
from sklearn.pipeline import Pipeline
plt.rcParams['font.sans-serif'] = ['SimHei']
plt.rcParams['font.serif'] = ['SimHei']
plt.rcParams['axes.unicode_minus'] = False
np.random.seed(100)
np.set_printoptions(linewidth=1000, suppress=True)
N = 10
x = np.linspace(0, 6, N) + np.random.rand(N)
y = 1.8 * x ** 3 + x ** 2 - 14 * x - 7 + np.random.randn(N)
x.shape = -1, 1
y.shape = -1, 1
models = [
Pipeline([
('Poly', PolynomialFeatures()),
('Linear', LinearRegression())
]),
Pipeline([
('Poly', PolynomialFeatures()),
('Linear', RidgeCV(alphas=np.logspace(-3, 2, 50), fit_intercept=False))
]),
Pipeline([
('Poly', PolynomialFeatures()),
('Linear', LassoCV(alphas=np.logspace(-3, 2, 50), fit_intercept=False))
]),
Pipeline([
('Poly', PolynomialFeatures()),
('Linear', ElasticNetCV(alphas=np.logspace(-3, 2, 50), fit_intercept=False))
])
]
plt.figure(facecolor='w')
degree = np.arange(1, N, 2)
dm = degree.size
colors = []
for c in np.linspace(16711689, 255, dm):
c = int(c)
colors.append('#%06x' % c)
title = [u'Linear_Regression', u'Ridge_Regression', u'Lasso_Regression', u'Elastic_Net']
for t in range(4):
model = models[t]
plt.subplot(2, 2, t + 1)
plt.plot(x, y, 'ro', ms=10, zorder=N)
for i, d in enumerate(degree):
model.set_params(Poly__degree=d)
model.fit(x, y.ravel())
lin = model.get_params('Linear')['Linear']
output = u'%s:%d阶, 系数为:' % (title[t], d)
print(output, lin.coef_.ravel())
x_hat = np.linspace(x.min(), x.max(), num=100)
x_hat.shape = -1, 1
y_hat = model.predict(x_hat)
s = model.score(x, y)
z = N - 1 if (d == 2) else 0
label = u'%dscala, Accuracy rate=%.3f' % (d, s)
plt.plot(x_hat, y_hat, color=colors[i], lw=2, alpha=0.75, label=label, zorder=z)
plt.legend(loc='upper left')
plt.grid(True)
plt.title(title[t])
plt.xlabel('X', fontsize=16)
plt.ylabel('Y', fontsize=16)
plt.tight_layout(1, rect=(0, 0, 4, 2))
plt.show()
结果如下所示:
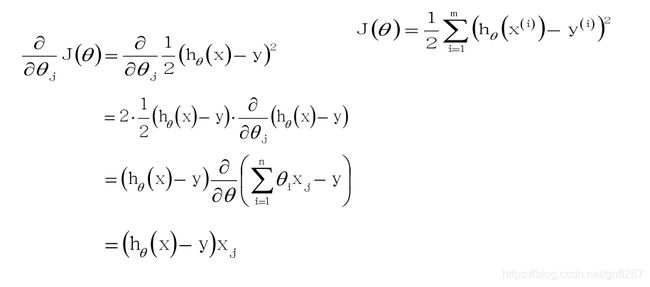
(2)梯度下降法:
1.梯度下降算法:
对J(θ)使用梯度下降法:
梯度下降法又分为批量梯度下降(BGD),随机梯度下降(SGD),小批量梯度下降(MBGD)
BGD和SGD的比较:
(1)SGD速度比BGD快(迭代次数少)
(2)SGD在某些情况下(全局存在多个相对最优解/J(θ)不是一个二次),SGD有可能跳出某些小的局部最优解,所以不会比BGD坏,BGD一定能够得到一个局部最优解(在线性回归模型中一定是得到一个全局最优解)。
(3)SGD由于随机性的存在可能导致最终结果比BGD的差。
如果即需要保证算法的训练过程比较快,又需要保证最终参数训练的准确率,而这正是小批量梯度下降法(Mini-batch Gradient Descent,简称MBGD)的初衷。MBGD中不是每拿一个样本就更新一次梯度,而且拿b个样本(b一般为10)的平均梯度作为更新方向。
下面是利用随机梯度下降法实现“波士顿房价预测”的代码:
import numpy as np
import pandas as pd
import matplotlib as mpl
import time
import matplotlib.pyplot as plt
import sklearn
from sklearn.linear_model import LinearRegression, LassoCV, RidgeCV, ElasticNetCV, SGDRegressor
from sklearn.model_selection import train_test_split
from sklearn.preprocessing import StandardScaler
from sklearn.preprocessing import PolynomialFeatures
from sklearn.pipeline import Pipeline
from sklearn.model_selection import GridSearchCV
def notEmpty(s):
return s != ''
fd = pd.read_csv('../datas/housing.data', header=None)
datas = np.empty((len(fd.values), 14))
for (i, d) in enumerate(fd.values):
d = list(map(float, filter(notEmpty, d[0].split(' '))))
datas[i] = np.array(d)
x, y = np.split(datas, (13, ), axis=1)
x_train, x_test, y_train, y_test = train_test_split(x, y, test_size=0.2, random_state=0)
ss = StandardScaler()
x_train = ss.fit_transform(x_train)
x_test = ss.transform(x_test)
model = SGDRegressor(loss='squared_loss',penalty='l2',alpha=0.01,max_iter=1000)
model.fit(x_train, y_train)
y_predict = model.predict(x_test)
print("训练值得分:", model.score(x_train, y_train))
print("测试值得分:", model.score(x_test, y_test))
ln_x = range(len(x_test))
plt.plot(ln_x, y_test, 'r-', lw = 3)
plt.plot(ln_x, y_predict, 'g-', lw = 3)
plt.show()
结果如下:


