matplotlib绘制3D图像
用Axes3D类创建3d ax
import matplotlib.pyplot as plt
from mpl_toolkits.mplot3d import Axes3D

fig = plt.figure(figsize=(8, 8))
ax = Axes3D(fig, auto_add_to_figure=False)
fig.add_axes(ax)
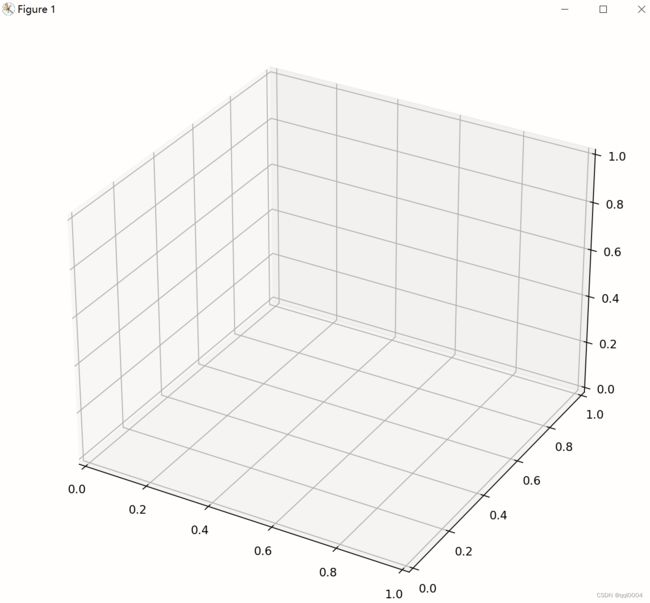
plt.show()
结果如图:
一、柱状图
ax.bar(x, height, zs, zdir, color, ...)
x和height用来表示一个面的柱状图,z用来指定哪个面,zdir用来指定面的方向(沿x轴、y轴或z轴)
import numpy as np
import matplotlib.pyplot as plt
from mpl_toolkits.mplot3d import Axes3D

plt.rcParams['font.sans-serif'] = ['STKAITI']
plt.rcParams['axes.unicode_minus'] = False
plt.rcParams['axes.facecolor'] = '#cc00ff'

fig = plt.figure(figsize=(8, 8))
ax = Axes3D(fig, auto_add_to_figure=False)
fig.add_axes(ax)
zs = range(5)
left = np.arange(0, 10)
for i in range(len(zs)):
    z = zs[i]
    np.random.seed(i)
    height = np.random.randint(0, 30, size=10)
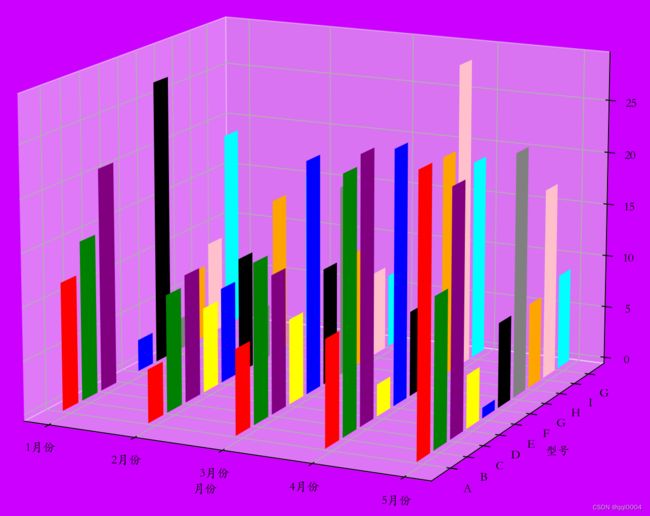
    ax.bar(left, height, zs=z, zdir='x',
    color=['red', 'green', 'purple', 'yellow', 'blue', 'black', 'gray', 'orange', 'pink', 'cyan'])
plt.xticks(zs, ['1月份', '2月份', '3月份', '4月份', '5月份'])
plt.yticks(left, ['A', 'B', 'C', 'D', 'E', 'F', 'G', 'H', 'I', 'G'])
plt.xlabel('月份')
plt.ylabel('型号')
plt.show()
结果如图:
二、曲面图/散点图
ax.plot_surface(X, Y, Z, rstride, cstride, cmap, ...)
X, Y为meshgrid生成的二维数组(分别存储网格中每个点的x和y坐标),rstride和cstride分别指定行的跨度和列的跨度
import numpy as np
import matplotlib.pyplot as plt
from mpl_toolkits.mplot3d import Axes3D

plt.rcParams['font.sans-serif'] = ['STKAITI']
plt.rcParams['axes.unicode_minus'] = False
plt.rcParams['axes.facecolor'] = '#cc00ff'
delta = 0.125

x = np.arange(-4, 4, delta)
y = np.arange(-3.0, 4.0, delta)
X, Y = np.meshgrid(x, y)  # y行x列的grid
Z1 = np.exp(-X**2 - Y**2)
Z2 = np.exp(-(X-1)**2 - (Y-1)**2)
Z = (Z1 - Z2) * 2
fig1 = plt.figure(figsize=(8, 8))
ax1 = Axes3D(fig1, auto_add_to_figure=False)
fig1.add_axes(ax1)
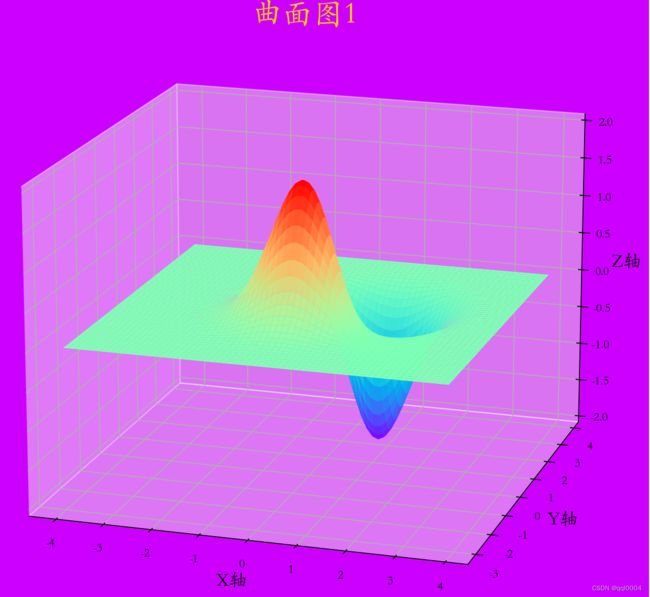
ax1.plot_surface(X, Y, Z, rstride=1, cstride=1, cmap=plt.get_cmap('rainbow'))
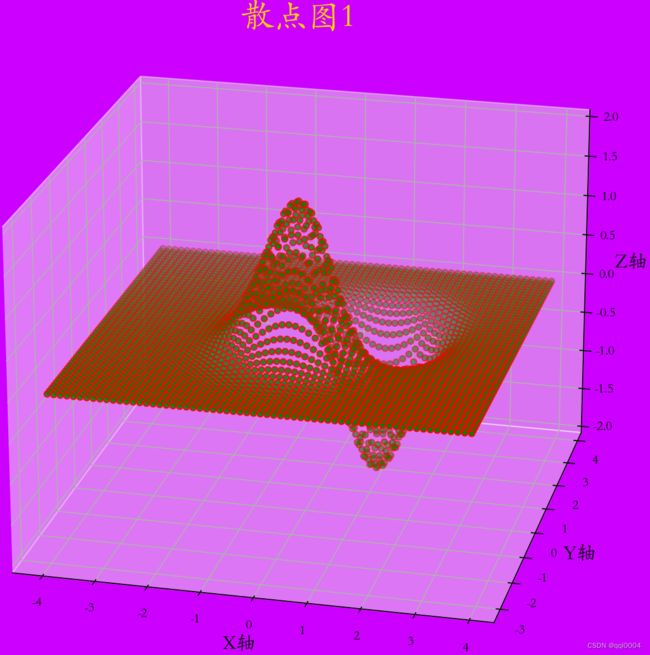
# ax1.scatter(X, Y, Z, c='green', edgecolors='red')  # 散点图
plt.xlabel('X轴', fontsize=15)
plt.ylabel('Y轴', fontsize=15)
ax1.set_zlabel('Z轴', fontsize=15)
ax1.set_zlim(-2, 2)
plt.title('曲面图1', y=1.00, fontsize=25, color='gold')
# plt.title('散点图1', y=1.00, fontsize=25, color='gold')
plt.show()
结果如图:
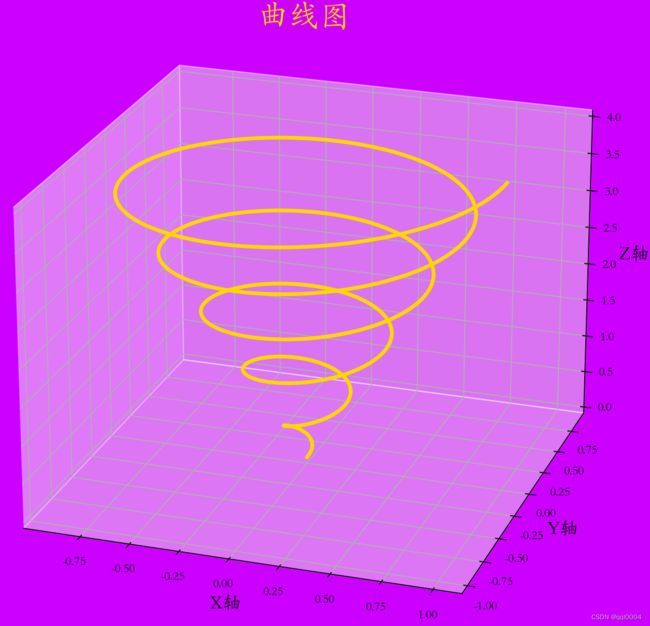
三、曲线图
ax.plot(x, y, z, color, lw, ...)
x,y,z大小相同(比如均为长1000的列表),分别表示每个点的x,y,z坐标,函数绘制每个点并依次连接成曲线
import numpy as np
import matplotlib.pyplot as plt
from mpl_toolkits.mplot3d import Axes3D

plt.rcParams['font.sans-serif'] = ['STKAITI']
plt.rcParams['axes.unicode_minus'] = False
plt.rcParams['axes.facecolor'] = '#cc00ff'
delta = 0.125

theta = np.linspace(0, 3.14*10, 1000)  # 5个2pi周期
r = np.linspace(0, 1, 1000)
x = r * np.cos(theta)
y = r * np.sin(theta)
z = np.linspace(0, 4, 1000)
fig3 = plt.figure(figsize=(8, 8), facecolor='#cc00ff')
ax3 = Axes3D(fig3, auto_add_to_figure=False)
fig3.add_axes(ax3)
ax3.plot(x, y, z, color='gold', lw=3)  # 绘制1000个点,依次连接成曲线
plt.xlabel('X轴', fontsize=15)
plt.ylabel('Y轴', fontsize=15)
ax3.set_zlabel('Z轴', fontsize=15)
plt.title('曲线图', y=1.00, fontsize=25, color='gold')
plt.show()
结果如图:
参考:
python matplotlib绘制 3D图像专题 (三维柱状图、曲面图、散点图、曲线图合集) - 哔哩哔哩 (bilibili.com)
