python中用matplotlib画多个并列的柱状图(展示3种图)
首先如果柱状图中有中文,比如X轴和Y轴标签需要写中文,解决中文无法识别和乱码的情况,加下面这行代码就可以解决了:
plt.rcParams['font.sans-serif'] = ['SimHei'] # 解决中文乱码
以下总共展示了三种画不同需求的柱状图:
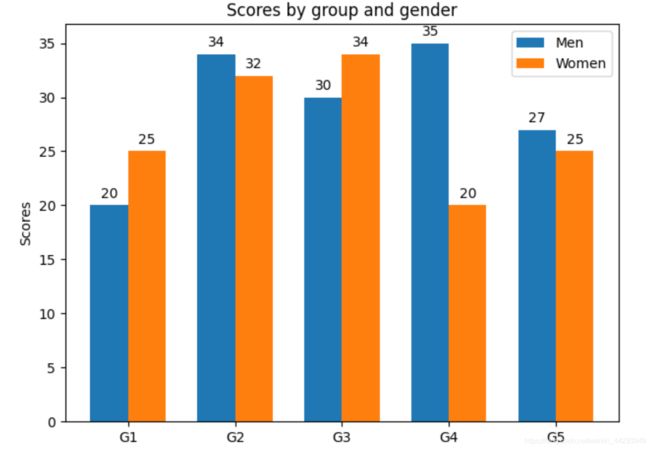
- 画多组两个并列的柱状图:
import matplotlib
import matplotlib.pyplot as plt
import numpy as np

plt.rcParams['font.sans-serif'] = ['SimHei']

labels = ['G1', 'G2', 'G3', 'G4', 'G5']
men_means = [20, 34, 30, 35, 27]
women_means = [25, 32, 34, 20, 25]

x = np.arange(len(labels))  # the label locations
width = 0.35  # the width of the bars

fig, ax = plt.subplots()
rects1 = ax.bar(x - width/2, men_means, width, label='Men')
rects2 = ax.bar(x + width/2, women_means, width, label='Women')

# Add some text for labels, title and custom x-axis tick labels, etc.
ax.set_ylabel('Scores')
ax.set_title('Scores by group and gender')
ax.set_xticks(x)
ax.set_xticklabels(labels)
ax.legend()


def autolabel(rects):
    """Attach a text label above each bar in *rects*, displaying its height."""
    for rect in rects:
        height = rect.get_height()
        ax.annotate('{}'.format(height),
                    xy=(rect.get_x() + rect.get_width() / 2, height),
                    xytext=(0, 3),  # 3 points vertical offset
                    textcoords="offset points",
                    ha='center', va='bottom')


autolabel(rects1)
autolabel(rects2)

fig.tight_layout()

plt.show()
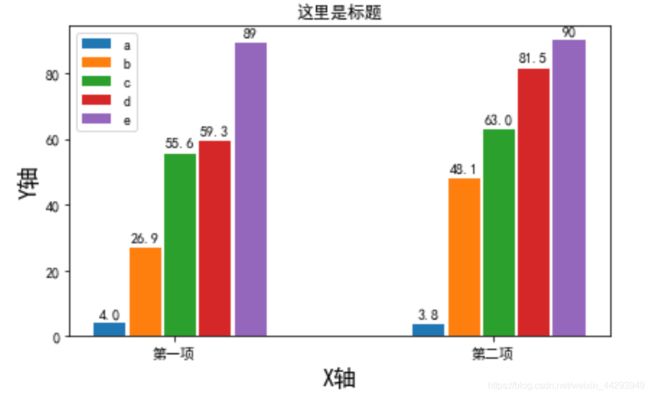
- 画两组5个并列的柱状图:
import matplotlib
import matplotlib.pyplot as plt
import numpy as np

plt.rcParams['font.sans-serif']=['SimHei'] # 解决中文乱码

labels = ['第一项', '第二项']
a = [4.0, 3.8]
b = [26.9, 48.1]
c = [55.6, 63.0]
d = [59.3, 81.5]
e = [89, 90]


x = np.arange(len(labels))  # 标签位置
width = 0.1  # 柱状图的宽度,可以根据自己的需求和审美来改

fig, ax = plt.subplots()
rects1 = ax.bar(x - width*2, a, width, label='a')
rects2 = ax.bar(x - width+0.01, b, width, label='b')
rects3 = ax.bar(x + 0.02, c, width, label='c')
rects4 = ax.bar(x + width+ 0.03, d, width, label='d')
rects5 = ax.bar(x + width*2 + 0.04, e, width, label='e')


# 为y轴、标题和x轴等添加一些文本。
ax.set_ylabel('Y轴', fontsize=16)
ax.set_xlabel('X轴', fontsize=16)
ax.set_title('这里是标题')
ax.set_xticks(x)
ax.set_xticklabels(labels)
ax.legend()


def autolabel(rects):
    """在*rects*中的每个柱状条上方附加一个文本标签,显示其高度"""
    for rect in rects:
        height = rect.get_height()
        ax.annotate('{}'.format(height),
                    xy=(rect.get_x() + rect.get_width() / 2, height),
                    xytext=(0, 3),  # 3点垂直偏移
                    textcoords="offset points",
                    ha='center', va='bottom')

autolabel(rects1)
autolabel(rects2)
autolabel(rects3)
autolabel(rects4)
autolabel(rects5)

fig.tight_layout()

plt.show()
绘制好的柱状图如下:

3. 要将柱状图的样式画成适合论文中使用的黑白并且带花纹的样式:
import matplotlib.pyplot as plt
import numpy as np

plt.rcParams['font.sans-serif'] = ['SimHei']  # 解决中文乱码

labels = ['第一项', '第二项']
a = [50, 80]
b = [37, 69]
c = [78, 60]
d = [66, 86]
e = [80, 95]
# marks = ["o", "X", "+", "*", "O"]

x = np.arange(len(labels))  # 标签位置
width = 0.1  # 柱状图的宽度

fig, ax = plt.subplots()
rects1 = ax.bar(x - width * 2, a, width, label='a', hatch="...", color='w', edgecolor="k")
rects2 = ax.bar(x - width + 0.01, b, width, label='b', hatch="oo", color='w', edgecolor="k")
rects3 = ax.bar(x + 0.02, c, width, label='c', hatch="++", color='w', edgecolor="k")
rects4 = ax.bar(x + width + 0.03, d, width, label='d', hatch="XX", color='w', edgecolor="k")
rects5 = ax.bar(x + width * 2 + 0.04, e, width, label='e', hatch="**", color='w', edgecolor="k")

# 为y轴、标题和x轴等添加一些文本。
ax.set_ylabel('Y', fontsize=16)
ax.set_xlabel('X', fontsize=16)
ax.set_title('标题')
ax.set_xticks(x)
ax.set_xticklabels(labels)
ax.legend()

