Python地理数据处理 十四:栅格数据处理(二)
目录
-
- 1.地面控制点(GCP)
- 2.多幅图像镶嵌
- 3.颜色表
- 4.直方图
1.地面控制点(GCP)
如果想将一个旧的航片或者扫描地图,变成地理数据集,可以运用控制点来进行变换。图像转换类型的不同,所需要的地面控制点的数量也不同,常用方法:一阶多项式(至少3个点)、多项式变换(尽可能多的控制点)、样条插值法(对数据的不同部分使用不同的方程,可以精确拟合所提供的控制点,但可能导致图像其他部分扭曲)。
样条插值法:
使用GDAL自带的 gdal warp 程序进行各种插值方法。获取点坐标的过程比较艰难,但是必须人工完成。
gdalwarp [--help-general] [--formats]
    [-s_srs srs_def] [-t_srs srs_def] [-to "NAME=VALUE"]
    [-order n | -tps | -rpc | -geoloc] [-et err_threshold]
    [-refine_gcps tolerance [minimum_gcps]]
    [-te xmin ymin xmax ymax] [-te_srs srs_def]
    [-tr xres yres] [-tap] [-ts width height]
    [-ovr level|AUTO|AUTO-n|NONE] [-wo "NAME=VALUE"] [-ot Byte/Int16/...] [-wt Byte/Int16]
    [-srcnodata "value [value...]"] [-dstnodata "value [value...]"] -dstalpha
    [-r resampling_method] [-wm memory_in_mb] [-multi] [-q]
    [-cutline datasource] [-cl layer] [-cwhere expression]
    [-csql statement] [-cblend dist_in_pixels] [-crop_to_cutline]
    [-of format] [-co "NAME=VALUE"]* [-overwrite]
    [-nomd] [-cvmd meta_conflict_value] [-setci] [-oo NAME=VALUE]*
    [-doo NAME=VALUE]*
    srcfile* dstfile
更详细的解释:GDAL工具箱详解之gdalwarp.exe
1.为栅格数据添加地面控制点:
import os
import shutil
from osgeo import gdal, osr

os.chdir(r'D:\Utah')
shutil.copy('cache_no_gcp.tif', 'cache.tif')

# 打开复制的图像,添加GCPs
ds = gdal.Open('cache.tif', gdal.GA_Update)

# 创建GCP坐标使用的SRS
sr = osr.SpatialReference()
sr.SetWellKnownGeogCS('WGS84')

# 创建GCPs列表
gcps = [gdal.GCP(-111.931075, 41.745836, 0, 1078, 648),
        gdal.GCP(-111.901655, 41.749269, 0, 3531, 295),
        gdal.GCP(-111.899180, 41.739882, 0, 3722, 1334),
        gdal.GCP(-111.930510, 41.728719, 0, 1102, 2548)]

# 将GCPs添加到栅格
ds.SetGCPs(gcps, sr.ExportToWkt())
ds.SetProjection(sr.ExportToWkt())
ds = None

# 使用驱动程序创建一个栅格的副本
# 添加一个geotransform而不是GCPs (这仍然使用上面的sr和gcps变量)
old_ds = gdal.Open('cache_no_gcp.tif')
ds = old_ds.GetDriver().CreateCopy('cache2.tif', old_ds)
ds.SetProjection(sr.ExportToWkt())
ds.SetGeoTransform(gdal.GCPsToGeoTransform(gcps))
del ds, old_ds
gdal.GCP([x], [y], [z], [pixel], [line], [info], [id]):
- x、y、z是对应的真实世界坐标,可选,默认为0。
- pixel是具有已知坐标的像素的列偏移,可选,默认为0。
- line是具有已知坐标的像素的行偏移,可选,默认为0。
- info和id是两个用于标识地面控制点的可选字符串,但不适合用于图像,默认为none。
结果显示:
(由于控制点太小,无法在图像中显示)
2.多幅图像镶嵌
def get_extent(fn):
    '''Returns min_x, max_y, max_x, min_y'''
    ds = gdal.Open(fn)
    gt = ds.GetGeoTransform()
    return (gt[0], gt[3], gt[0] + gt[1] * ds.RasterXSize,
        gt[3] + gt[5] * ds.RasterYSize)  # gt[1]为像素宽度、gt[5]为像素高度(负数)
import glob
import math
import os
from osgeo import gdal, osr

os.chdir(r'D:\Massachusetts')

# 获取以O开头的tiff列表
in_files = glob.glob('O*.tif')

# 遍历所有的输入文件
# 计算输出影响范围
min_x, max_y, max_x, min_y = ch10funcs.get_extent(in_files[0])
for fn in in_files[1:]:
    minx, maxy, maxx, miny = ch10funcs.get_extent(fn)
    min_x = min(min_x, minx)
    max_y = max(max_y, maxy)
    max_x = max(max_x, maxx)
    min_y = min(min_y, miny)

# 根据输出范围计算输出的维度,计算尺寸
in_ds = gdal.Open(in_files[0])
gt = in_ds.GetGeoTransform()

# ceil函数为向上取整,保证不会切断边缘
rows = math.ceil((max_y - min_y) / -gt[5]) # 这里是像素高度,为负数
columns = math.ceil((max_x - min_x) / gt[1])

# 创建输出
driver = gdal.GetDriverByName('gtiff')
out_ds = driver.Create('mosaic.tif', columns, rows)
out_ds.SetProjection(in_ds.GetProjection())
out_band = out_ds.GetRasterBand(1)

# 计算新的地理转换
gt = list(in_ds.GetGeoTransform())
gt[0], gt[3] = min_x, max_y       # 影像的左上角坐标
out_ds.SetGeoTransform(gt)

for fn in in_files:
    in_ds = gdal.Open(fn)

    # 获取输出偏移值
    trans = gdal.Transformer(in_ds, out_ds, [])
    success, xyz = trans.TransformPoint(False, 0, 0)
    x, y, z = map(int, xyz)

    # 复制数据
    data = in_ds.GetRasterBand(1).ReadAsArray()
    out_band.WriteArray(data, x, y)


# 获取out_ds在第1078列和第648行处的实际坐标
trans = gdal.Transformer(out_ds, None, []) # 创建一个Transformer转换器
success, xyz = trans.TransformPoint(0, 1078, 648)
print(xyz)

del in_ds, out_band, out_ds
第1078列和第648行处的实际坐标:
(397255.0, 4664074.0, 0.0)
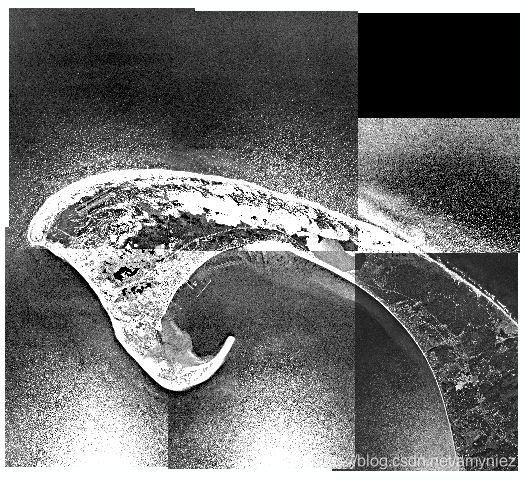
结果显示:
已拼接:
可以看出镶嵌后的图像颜色是不均匀的,可以使用 fancier 算法来平均像素值。
3.颜色表
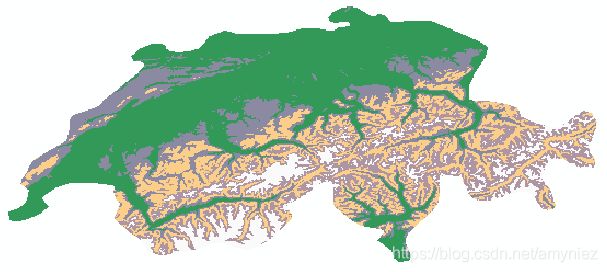
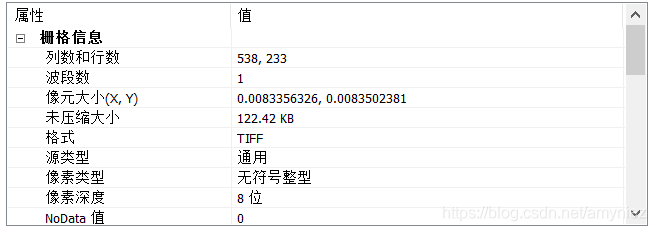
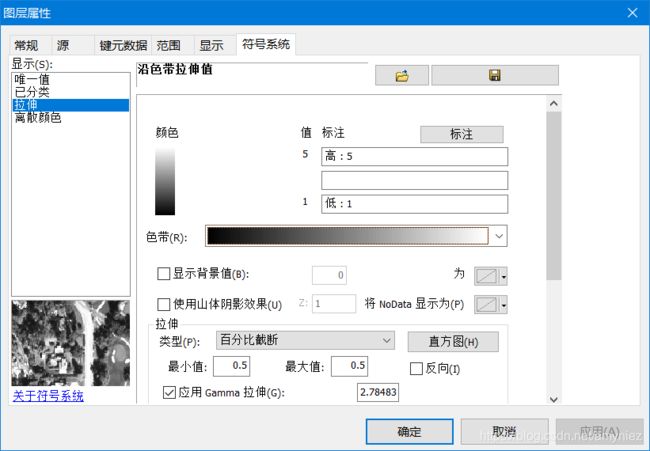
颜色表只适用于整数类型的栅格数据。为栅格影像添加颜色映射:
1. 颜色表信息:
import os
from osgeo import gdal

os.chdir(r'D:\Switzerland')

# 数据集备份
original_ds = gdal.Open('dem_class.tif')  # 颜色表
driver = gdal.GetDriverByName('gtiff')
ds = driver.CreateCopy('dem_class_2.tif', original_ds)
band = ds.GetRasterBand(1)

# 创建一个RGB颜色表
# 添加对应的颜色值
colors = gdal.ColorTable()
colors.SetColorEntry(1, (50, 153, 89))
colors.SetColorEntry(2, (140, 138, 162))
colors.SetColorEntry(3, (251, 206, 138))
colors.SetColorEntry(4, (174, 149, 164))
colors.SetColorEntry(5, (73, 133, 176))

# 将颜色表添加到波段中
band.SetRasterColorTable(colors)
band.SetRasterColorInterpretation(
    gdal.GCI_PaletteIndex)

del band, ds
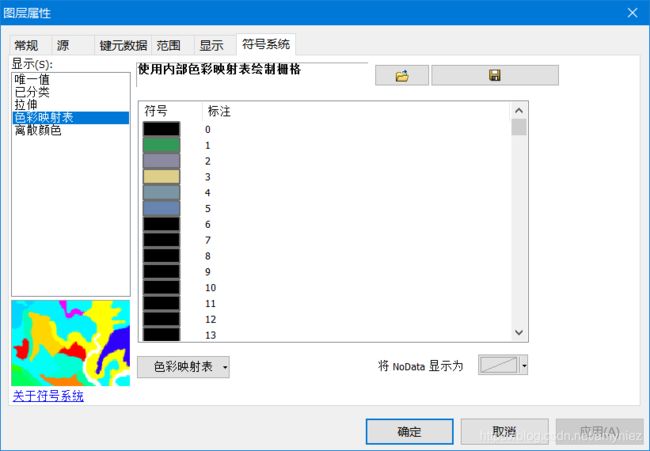
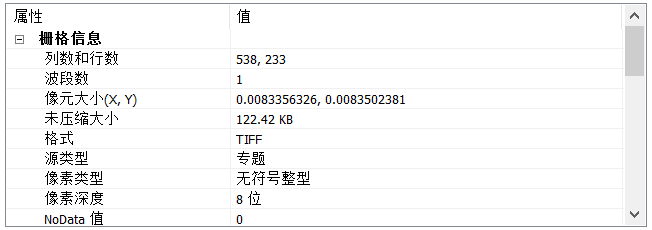
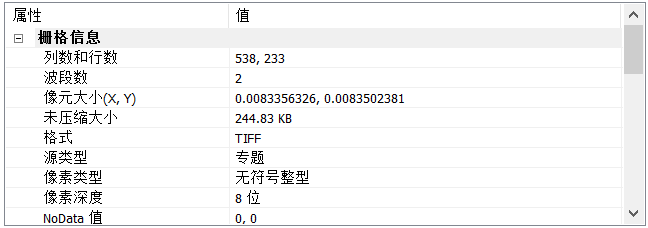
属性信息:
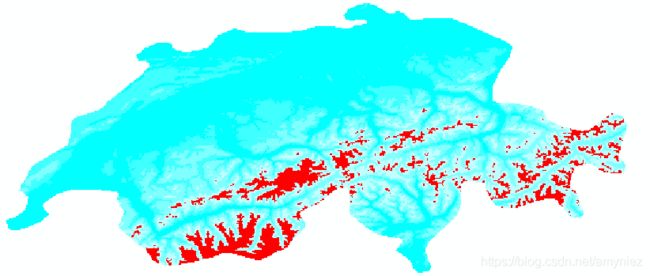
2. 编辑现有颜色:
import os
from osgeo import gdal

data_dir = r'D:\Utah'
os.chdir(os.path.join(data_dir, 'Switzerland'))
original_ds = gdal.Open('dem_class_2.tif')
ds = original_ds.GetDriver().CreateCopy('dem_class_3.tif', original_ds)

# 从波段中获取现有的颜色表
band = ds.GetRasterBand(1)
colors = band.GetRasterColorTable()

# 更改为5的像素值,以便显示高海拔范围地区(白色)
colors.SetColorEntry(5, (250, 250, 250))

# 将修改后的颜色表添加到栅格波段上
band.SetRasterColorTable(colors)
del band, ds
3. RGBA设置:
import os
import numpy as np
from osgeo import gdal

data_dir = r'D:\Utah'

os.chdir(os.path.join(data_dir, 'Switzerland'))
original_ds = gdal.Open('dem_class_2.tif')
driver = gdal.GetDriverByName('gtiff')

# alpha值越高越不透明
# 需要创建2个波段,波段1储存像素值,波段2储存alpha值
ds = driver.Create('dem_class_4.tif', original_ds.RasterXSize,
    original_ds.RasterYSize, 2, gdal.GDT_Byte, ['ALPHA=YES'])

# 添加投影和地理变换信息到副本
ds.SetProjection(original_ds.GetProjection())
ds.SetGeoTransform(original_ds.GetGeoTransform())

# 从dem_class_2中读入数据
original_band1 = original_ds.GetRasterBand(1)
data = original_band1.ReadAsArray()

# 将数据写入新栅格的波段1,并复制颜色表
band1 = ds.GetRasterBand(1)
band1.WriteArray(data)
band1.SetRasterColorTable(original_band1.GetRasterColorTable())
band1.SetRasterColorInterpretation(gdal.GCI_PaletteIndex)
band1.SetNoDataValue(original_band1.GetNoDataValue())

ds.FlushCache()

# 使用numpy库
# 在数据数组中找到像素值为5的地方,将值设置为65,其他设置为255
data = band1.ReadAsArray()
# if——else语句,判断像素值是否等于5
data = np.where(data == 5, 65, 255)

# 将修改后的数据数组写入新光栅的第二个波段(alpha)
band2 = ds.GetRasterBand(2)
band2.WriteArray(data)
band2.SetRasterColorInterpretation(gdal.GCI_AlphaBand)

del ds, original_ds
4.直方图
通过 GetHistogram()函数 获取像素频率直方图,可以计算植被分类中每种植被类型的面积。可以指定要使用的组距(默认为256),第一个:-0.5 - 0.5、第二个:0.5 - 1.5,以此类推。
函数签名:
GetHistogram([min], [max], [buckets], [include_out_of_range], [approx_ok],[callback], [callback_data])
min:直方图最小像素值,默认为0.5
max:直方图最大像素值,默认为255.5
buckets:组距数量,默认为256
include_out_of_range:是否将最小像素值聚集到最小组距中,将大于最大值的像素值聚集到最大组距中,默认False
approx_ok:是否使用近似数值,函数将运行更快,默认为True。如果计算精确数值,设置为False。
callback:计算直方图时定期调用的函数,对于处理大型数据集有用,默认为0,表示不用callback
callback_data:传递给回调函数数据
import os
from osgeo import gdal

data_dir = r'D:\Utah'
os.chdir(os.path.join(data_dir, 'Switzerland'))
ds = gdal.Open('dem_class_2.tif')
band = ds.GetRasterBand(1)
approximate_hist = band.GetHistogram()
exact_hist = band.GetHistogram(approx_ok=False)
print('近似值:', approximate_hist[:7], sum(approximate_hist))
print('精确值:', exact_hist[:7], sum(exact_hist))

# 默认直方图
print(band.GetDefaultHistogram())

# 更改默认直方图,使1和2合并,3和4合并,单独留下5
hist = band.GetHistogram(0.5, 6.5, 3, approx_ok=False)
band.SetDefaultHistogram(1, 6, hist)

# 默认直方图
print(band.GetDefaultHistogram())

# 从默认直方图中获取最小像素、最大像素、组距、计数列表元组
min_val, max_val, n, hist = band.GetDefaultHistogram()
print(min_val, max_val, n)
print(hist)
近似值: [0, 6564, 3441, 3531, 2321, 802, 0] 16659
精确值: [0, 27213, 12986, 13642, 10632, 5414, 0] 69887

(-0.5, 255.5, 256, [0, 6564, 3441, 3531, 2321, 802, 0, 0, 0, 0, 0, 0, 0, 0, 0, 0, 0, 0, 0, 0, 0, 0, 0, 0, 0, 0, 0, 0, 0, 0, 0, 0, 0, 0, 0, 0, 0, 0, 0, 0, 0, 0, 0, 0, 0, 0, 0, 0, 0, 0, 0, 0, 0, 0, 0, 0, 0, 0, 0, 0, 0, 0, 0, 0, 0, 0, 0, 0, 0, 0, 0, 0, 0, 0, 0, 0, 0, 0, 0, 0, 0, 0, 0, 0, 0, 0, 0, 0, 0, 0, 0, 0, 0, 0, 0, 0, 0, 0, 0, 0, 0, 0, 0, 0, 0, 0, 0, 0, 0, 0, 0, 0, 0, 0, 0, 0, 0, 0, 0, 0, 0, 0, 0, 0, 0, 0, 0, 0, 0, 0, 0, 0, 0, 0, 0, 0, 0, 0, 0, 0, 0, 0, 0, 0, 0, 0, 0, 0, 0, 0, 0, 0, 0, 0, 0, 0, 0, 0, 0, 0, 0, 0, 0, 0, 0, 0, 0, 0, 0, 0, 0, 0, 0, 0, 0, 0, 0, 0, 0, 0, 0, 0, 0, 0, 0, 0, 0, 0, 0, 0, 0, 0, 0, 0, 0, 0, 0, 0, 0, 0, 0, 0, 0, 0, 0, 0, 0, 0, 0, 0, 0, 0, 0, 0, 0, 0, 0, 0, 0, 0, 0, 0, 0, 0, 0, 0, 0, 0, 0, 0, 0, 0, 0, 0, 0, 0, 0, 0, 0, 0, 0, 0, 0, 0, 0, 0, 0, 0, 0, 0, 0, 0, 0, 0, 0, 0])

(1.0, 6.0, 3, [40199, 24274, 5414])

1.0 6.0 3
[40199, 24274, 5414]

