MATLAB-泛洪(Flooding)协议仿真
MATLAB-无线传感器网络泛洪(Flooding)协议仿真
- 总结
-
- 一.界面介绍
- 二、 Flooding算法工作流程图
- 三、 .m文件
-
- flooding.m
- DFS_num.m(DFS数据传输阶段)
- distance.m
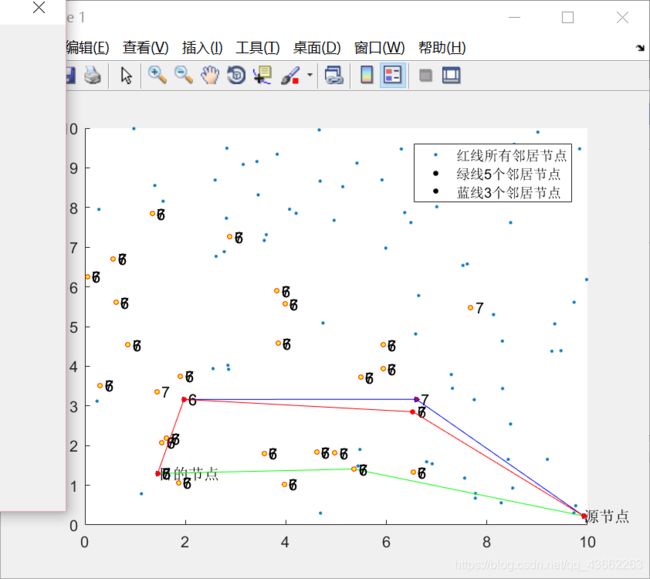
- 四、效果展示
- 五、代码讲解
-
- 1.操作说明:
- 2.关于邻居节点的选取
-
- flooding.m相关的代码
- DFS_num
总结
- 我选取所需邻居节点的思想是从所有邻居节点中随机选取所需的节点数,在一定方面上,这种选取的方法是有一定不足的,性能也没有很好。应该要经过运用某种距离算法,在已知所有邻居节点中择优选取最佳的邻居节点。在我目前能力不足,只能实现这种方法:在已知的所有邻居节点中随机选取5个邻居节点。
- 在运行时间对比上,我只选取了10个点,其实这种做法也是不足的,应该选取至少100多个点去比较性能,才能有更大的说服力。
- 代码还有很多地方想要改进,如果你有更好的想法与实现方案,欢迎来交流啊!分享一下自己的经验与心得。
参考文档链接
1.无线传感器网络flooding路由协议的MATLAB仿真论文
2.原代码出处_MATLAB实现洪泛路由的模拟
注
若复制的代码不能运行,联系我;
或在这个链接里自行下载
链接:https://pan.baidu.com/s/1bXKE7QWY5JNycOWpiBfa7g
提取码:zkrt
一.界面介绍
1.主窗口:含五个按钮:开始绘图按钮、所有邻居节点的Flooding按钮、5个邻居节点的Flooding按钮、3个邻居节点的Flooding按钮、点击运行效率对比按钮
2.绘图窗口
3.绘制路线窗口,点上标的76543210代表跳数,空心点代表寻找过的邻居节点

所有邻居节点的Flooding

5个邻居节点的Flooding

3个邻居节点的Flooding

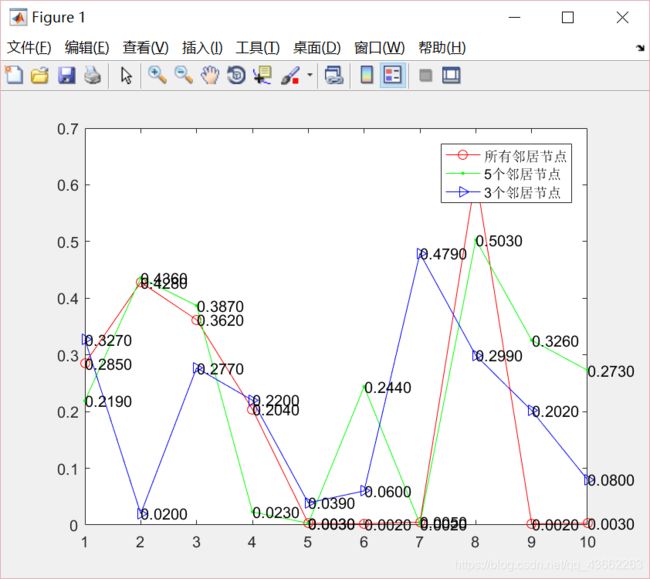
4.查找路线节点运行效率曲线对比窗口
二、 Flooding算法工作流程图
三、 .m文件
flooding.m
%% 界面介绍

% 1.主窗口:含五个按钮:开始绘图按钮、所有邻居节点的Flooding按钮、

%   5个邻居节点的Flooding按钮、3个邻居节点的Flooding按钮、点击运行效率对比按钮

% 2.绘图窗口

% 3.绘制路线窗口,点上标的76543210代表跳数

% 4.查找路线节点运行效率曲线对比窗口


%% 操作说明:

% 1.首先点击开始绘图按钮,创建图像;

% 2.点击所有邻居节点的Flooding按钮,绘制路线,线段颜色为红色;

% 3.点击5个邻居节点的Flooding按钮,绘制路线,线段颜色为绿色;

% 4.点击3个邻居节点的Flooding按钮,绘制路线,线段颜色为蓝色;

% 5.经过以上的步骤,我们已经得到了三个算法的一条路线及一个查找路线节点的时间,后即可关闭绘制的窗口,

%   重新绘制新的路线、计算新的查找路线节点的时间,重复1、2、3、4步骤10次,获取每个算法10个不同的查找路线节点的时间

%   (因为在运行效率对比按钮那我用了10个数据点去绘制对比曲线,所以,当某一个算法的数据点不足10个或大于10个时,

%
都无法绘制曲线成功)

%   (命令行窗口会有节点序号、查找路线节点的时间的记录反馈);

%   (当数据点不足10个时,接着画;大于10个时,只能关闭程序,重新画了(因为我没有提供删除时间的功能));

% 6.当集满三个算法的时间后,即可点击运行效率对比按钮,查看三个算法的查找路线节点时间曲线对比图。

%   (注:有时候没有返回值,是因为没有找到路线,关掉窗口,重新绘制个图,重新找)


%% 主程序

function flooding

%用于存放三个算法的运行事件

global flooding1;

global flooding5;

global flooding3;

flooding1=[];

flooding5=[];

flooding3=[];

%用于标记邻居节点数,0代表所有个,5代表5个,3代表3个

num1=0;

num2=5;

num3=3;

%创建窗口

fig = uifigure;

% 创建按钮

%所有制邻居节点的Flooding按钮

btn1 = uibutton(fig,'push',...

              'Position',[120, 330, 200,
34],...

               'Text', '所有制邻居节点的Flooding',...

              'ButtonPushedFcn', @(btn1,event)
plotButtonPushed1(btn1,num1));

%5个邻居节点的Flooding按钮

btn2 = uibutton(fig,'push',...

              'Position',[120, 230, 200,
34],...

               'Text', '5个邻居节点的Flooding',...

              'ButtonPushedFcn', @(btn2,event)
plotButtonPushed2(btn2,num2));

%5个邻居节点的Flooding按钮

btn3 = uibutton(fig,'push',...

              'Position',[120, 130, 200,
34],...

               'Text', '3个限制邻居节点的Flooding',...

              'ButtonPushedFcn', @(btn3,event)
plotButtonPushed3(btn3,num3));

%三个算法的运行效率对比

btn4 = uibutton(fig,'push',...

              'Position',[230, 30, 200,
34],...

               'Text', '运行效率对比',...

              'ButtonPushedFcn', @(btn4,event)
plotButtonPushed4(btn4));

%开始绘图按钮

btn5 = uibutton(fig,'push',...


     'Position',[20, 30, 200,
34],...

               'Text', '开始绘图',...

              'ButtonPushedFcn', @(btn5,event)
plotButtonPushed5(btn5));


end


function plotButtonPushed1(btn1,num1)

global flooding1;

global srcx;

global destx;

global xLocation;

global yLocation;

global route;%记录传输路径

global radius;%作用范围

global distMatrix;

global numOfNodes;

global success;%标记是否成功访问到目的节点

success=0;

global visited;%标记节点是否被访问过

visited=zeros(1,100);%初始时都未被访问

route=[];

global neighborNodes;%记录传输路径

neighborNodes=[];

%% 建立距离矩阵


distMatrix = zeros(numOfNodes);


for i=1:numOfNodes


for j=i+1:numOfNodes


distMatrix(i,j)=distance([xLocation(i),yLocation(i)],[xLocation(j),yLocation(j)]);


end


distMatrix(i,i)=10;%排除自身节点


end


distMatrix = distMatrix+distMatrix';


%% 开始查找

% clock用于计算查找节点的时间,ttl是条数

ttl=7;

t1=clock;

DFS_num(srcx,ttl,num1);

t2=clock;

%将记录下来的时间放入flooding1

i=length(flooding1)+1;

flooding1(i)=etime(t2,t1);

disp('所有邻居节点查找路线节点所需的时间为:');

disp(flooding1);

%% 画出传输路径图


if(ismember(destx,route))


disp('传输成功')


j=length(route);


while(j~=1)


for i=1:j-1


if(distMatrix(route(i),route(j))<=radius&&i~=j-1)


               route(i+1:1:j-1)=[];


break;


end


end


j=i;


end


else


route=[];


disp('传输失败');


end

%绘制路线

plot(xLocation(route),yLocation(route),'o-r','Markerfacecolor','r','MarkerSize',3);

disp('所有邻居节点路线上的节点序号为:');

disp(route)


end


% Create the function for the
ButtonPushedFcn callback

function plotButtonPushed2(btn2,num2)

global flooding5;

global srcx;

global destx;

global xLocation;

global yLocation;

global route;%记录传输路径

global numOfNodes;

global distMatrix;

global radius;%作用范围

global success;%标记是否成功访问到目的节点

success=0;

global visited;%标记节点是否被访问过

visited=zeros(1,100);%初始时都未被访问

route=[];

global neighborNodes;%记录传输路径

neighborNodes=[];

%% 建立距离矩阵


distMatrix = zeros(numOfNodes);


for i=1:numOfNodes


for j=i+1:numOfNodes


distMatrix(i,j)=distance([xLocation(i),yLocation(i)],[xLocation(j),yLocation(j)]);


end


distMatrix(i,i)=10;%排除自身节点


end


distMatrix = distMatrix+distMatrix';

%% 开始查找

% clock用于计算查找节点的时间,ttl是条数

t11=clock;

num=5;

ttl=7;

DFS_num(srcx,ttl,num2);

%将记录下来的时间放入flooding5

t22=clock;

i=length(flooding5)+1;

flooding5(i)=etime(t22,t11);

disp('5个邻居节点查找路线节点所需的时间为:');

disp(flooding5);

%% 画出传输路径图


if(ismember(destx,route))


disp('传输成功')


j=length(route);


while(j~=1)


for i=1:j-1


if(distMatrix(route(i),route(j))<=radius&&i~=j-1)


               route(i+1:1:j-1)=[];


break;


end


end


j=i;


end


else


route=[];


disp('传输失败');


end

%绘制路线图

plot(xLocation(route),yLocation(route),'.-g','Markerfacecolor','r','MarkerSize',3);

disp('5个邻居节点路线上的节点序号为:');

disp(route)


end

function plotButtonPushed3(btn3,num3)

global flooding3;

global srcx;

global destx;

global xLocation;

global yLocation;

global route;%记录传输路径

global numOfNodes;

global distMatrix;

global radius;%作用范围

global success;%标记是否成功访问到目的节点

success=0;

global visited;%标记节点是否被访问过

visited=zeros(1,100);%初始时都未被访问

route=[];

global neighborNodes;%记录传输路径

neighborNodes=[];

%% 建立距离矩阵


distMatrix = zeros(numOfNodes);


for i=1:numOfNodes


for j=i+1:numOfNodes


distMatrix(i,j)=distance([xLocation(i),yLocation(i)],[xLocation(j),yLocation(j)]);


end


distMatrix(i,i)=10;%排除自身节点


end


distMatrix = distMatrix+distMatrix';

%% 开始查找

% clock用于计算查找节点的时间,ttl是条数

t111=clock;

num=3;

ttl=7;

DFS_num(srcx,ttl,num3);

%将记录下来的时间放入flooding3

t222=clock;

i=length(flooding3)+1;

flooding3(i)=etime(t222,t111);

disp('3个邻居节点查找路线节点所需的时间为:');

disp(flooding3);

%% 画出传输路径图


if(ismember(destx,route))


disp('传输成功')


j=length(route);


while(j~=1)


for i=1:j-1


if(distMatrix(route(i),route(j))<=radius&&i~=j-1)


               route(i+1:1:j-1)=[];


break;


end


end


j=i;


end


else


route=[];


disp('传输失败');


end

%绘制路线图

plot(xLocation(route),yLocation(route),'>-b','Markerfacecolor','r','MarkerSize',3);

disp('3个邻居节点路线上的节点序号为:');

disp(route)


end

function plotButtonPushed4(btn4)

global flooding1;

global flooding5;

global flooding3;


%记录10条算法的时间,


Ay=flooding1;%所有邻居节点的


Ax=[1,2,3,4,5,6,7,8,9,10];


By=flooding5;%5个邻居节点的


Bx=[1,2,3,4,5,6,7,8,9,10];


Cy=flooding3;%3个邻居节点的


Cx=[1,2,3,4,5,6,7,8,9,10];


   %绘制时间对比曲线图,注!必须有10条记录了才能绘制(因为x有10个点,y也得有10个点)

     plot(Ax,Ay,'o-r',Bx,By,'.-g',Cx,Cy,'>-b');

legend('所有邻居节点','5个邻居节点','3个邻居节点');

   %显示线段上的备注


for i=1:10


str1=sprintf('%2.4f',Ay(i));


str2=sprintf('%2.4f',By(i));

             str3=sprintf('%2.4f',Cy(i));


text(Ax(i),Ay(i),str1);


text(Bx(i),By(i),str2);


text(Cx(i),Cy(i),str3);


end


disp('所有邻居节点查找路线节点所需的时间为:');


disp(Ay);


disp('5个邻居节点查找路线节点所需的时间为:');


disp(By);


disp('3个邻居节点查找路线节点所需的时间为:');


disp(Cy);

end

function plotButtonPushed5(btn5)

% Create a figure window

global flooding1;

global flooding5;

global flooding3;

%global ttl;


%ttl=7;%设置最大传输跳数为7


%% 初始化无线传感网示意图


%.传感器节点区域界限


envSize=10;


%区域内传感器数量


global numOfNodes;


numOfNodes=100;


global radius;%作用范围


radius=5;


global xLocation;


global yLocation;


xLocation = rand(numOfNodes,1) * envSize;


yLocation = rand(numOfNodes,1) *
envSize;   %x,y坐标


global srcx;


global destx;


srcx = floor(0.1345 * numOfNodes)+1; %第srcx个节点作为源节点


destx = floor(0.5126 * numOfNodes)+1;%第destx个节点作为目的节点


global success;%标记是否成功访问到目的节点


success=0;


global visited;%标记节点是否被访问过


visited=zeros(1,100);%初始时都未被访问


global route;%记录传输路径


route=[];


global neighborNodes;%记录传输路径

neighborNodes=[];

%% 画图


figure(1);

hold on;


plot(xLocation, yLocation, '.');


plot(xLocation(srcx),yLocation(srcx),'ko','Markerfacecolor','k','MarkerSize',3);


plot(xLocation(destx),yLocation(destx),'ko','Markerfacecolor','k','MarkerSize',3);


text(xLocation(srcx),yLocation(srcx), '源节点');


text(xLocation(destx),yLocation(destx), '目的节点');%标记源节点和目的节点


src=[xLocation(srcx),yLocation(srcx)];
dest=[xLocation(destx),yLocation(destx)];


legend('红线所有邻居节点','绿线5个邻居节点','蓝线3个邻居节点');

end
DFS_num.m(DFS数据传输阶段)
function [] = DFS_num(r,ttl,num)% r:源节点
TTL:生存周期 num:邻居节点数


%%


global success;


global visited;%标记节点是否被访问过


global distMatrix;%节点间的距离矩阵


global destx;%目的节点


global radius;%作用范围


global route;%记录传输路径


global neighborNodes1;%记录所有邻居节点数


global xLocation;


global yLocation;


global neighborNodes;%记录所需邻居节点数


visited(r)=1;


if(success==1||ttl<0)


return;


end


if(~ismember(r,route))


route=[route,r];


else


temp=find(route==r);


route=[route,r];


route(temp+1:1:end)=[];


end


neighborNodes1=find(distMatrix(r,:)<=radius);%查找在作用范围内的邻节点,选取目标节点与所有区域的距离且小于规定范围的节点


neighborNodes1=intersect(neighborNodes1,
find(visited(:) == 0));%找到可访问的 neighborNodes是列向量


%所有邻居节点

if(num==0)

neighborNodes=neighborNodes1;

end


%5个邻居节点,从所有邻居节点中选取5个

if(num==5)


neighborNodes=zeros(num,1);

for i=1:num

neighborNodes(i)=neighborNodes1(int32(1+(length(neighborNodes1)-1)*rand));


end

end


%3个邻居节点,从所有邻居节点中选取5个

if(num==3)


neighborNodes=zeros(num,1);

for i=1:num

neighborNodes(i)=neighborNodes1(int32(1+(length(neighborNodes1)-1)*rand));


end

end


if(ismember(destx,neighborNodes))%如果邻节点中含有目的节点


success=1;


route=[route destx];


str=sprintf('%2.0f',ttl);   % 2位小数的浮点型text


text(xLocation(destx),yLocation(destx),str);


return;


end


%% 递归程序的出口


if (isempty(neighborNodes))%邻节点为空


route(end)=[];%删除当前源节点,返回上一层


 %画出寻找过的邻居节点,并显示是在第几跳查找到的


plot(xLocation(neighborNodes(k)),yLocation(neighborNodes(k)),'ro-','Markerfacecolor','y','MarkerSize',3)

str=sprintf('%2.0f',ttl);   % 2位小数的浮点型text


text(xLocation(neighborNodes(k)),yLocation(neighborNodes(k)),str);


return;


end


%% 递归--当前节点的邻节点中不含有目的节点,从其邻节点开始查找


ttl=ttl-1;


for k = 1:length(neighborNodes)


  %
if (visited(neighborNodes(k)) == 0)


if(neighborNodes(k)==destx)%当传给中心点时结束


success=1;


%画出寻找过的邻居节点,并显示是在第几跳查找到的

plot(xLocation(neighborNodes(k)),yLocation(neighborNodes(k)),'ro-','Markerfacecolor','y','MarkerSize',3)

str=sprintf('%2.0f',ttl+1);   % 2位小数的浮点型text


text(xLocation(neighborNodes(k)),yLocation(neighborNodes(k)),str);


break;


end;


  %画出寻找过的邻居节点,并显示是在第几跳查找到的


plot(xLocation(neighborNodes(k)),yLocation(neighborNodes(k)),'ro-','Markerfacecolor','y','MarkerSize',3)

str=sprintf('%2.0f',ttl+1);   % 2位小数的浮点型text


text(xLocation(neighborNodes(k)),yLocation(neighborNodes(k)),str);


  DFS_num(neighborNodes(k),ttl,num);


%end;


end;
distance.m
这是一个函数文件,建立脚本是选择函数脚本
%% 求两个节点之间的距离


function dis = distance(A,B)


dis = sqrt((A(1)-B(1))^2+(A(2)-B(2))^2);


end
四、效果展示
- 运行flooding.m
- 主窗口效果
五、代码讲解
1.操作说明:
1.首先点击开始绘图按钮,创建图像;
2.点击所有邻居节点的Flooding按钮,绘制路线,线段颜色为红色;
3.点击5个邻居节点的Flooding按钮,绘制路线,线段颜色为绿色;
4.点击3个邻居节点的Flooding按钮,绘制路线,线段颜色为蓝色;
5.经过以上的步骤,我们已经得到了三个算法的一条路线及一个查找路线节点的时间,后即可关闭绘制的窗口,重新绘制新的路线、计算新的查找路线节点的时间,重复1、2、3、4步骤10次,获取每个算法10个不同的查找路线节点的时间
(注:因为在运行效率对比按钮那我用了10个数据点去绘制对比曲线,所以,当某一个算法的数据点不足10个或大于10个时,都无法绘制曲线成功)
(注:命令行窗口会有节点序号、查找路线节点的时间的记录反馈);
(注:当数据点不足10个时,接着画;大于10个时,只能关闭程序,重新画了(因为我没有提供删除时间的功能));
6.当集满三个算法的时间后,即可点击运行效率对比按钮,查看三个算法的查找路线节点时间曲线对比图。
(注:有时候没有返回值,是因为没有找到路线,关掉窗口,重新绘制个图,重新找)
2.关于邻居节点的选取
- 选取的方法:在所有邻居节点中随机选取自己想要的个数,用num这个全局变量里设置。
- num变量在flooding.m中的function flooding定义,在按钮启动事件函数plotButtonPushed(btn,num)中调用给DFS_num.m进行选取。
flooding.m相关的代码
function flooding


%用于标记邻居节点数,0代表所有个,5代表5个,3代表3个


num1=0;

num2=5;

num3=3;


%所有制邻居节点的Flooding按钮

btn1 = uibutton(fig,'push',...

               'Position',[120, 330, 200,
34],...

                'Text', '所有制邻居节点的Flooding',...

               'ButtonPushedFcn', @(btn1,event)
plotButtonPushed1(btn1,num1));

%5个邻居节点的Flooding按钮

btn2 = uibutton(fig,'push',...

               'Position',[120, 230, 200,
34],...

                'Text', '5个邻居节点的Flooding',...

               'ButtonPushedFcn', @(btn2,event)
plotButtonPushed2(btn2,num2));

 %5个邻居节点的Flooding按钮

btn3 = uibutton(fig,'push',...

               'Position',[120, 130, 200,
34],...

                'Text', '3个限制邻居节点的Flooding',...

               'ButtonPushedFcn', @(btn3,event)
plotButtonPushed3(btn3,num3));

end


function plotButtonPushed1(btn1,num1)

%% 开始查找

DFS_num(srcx,ttl,num1);

End


function plotButtonPushed2(btn2,num2)

%% 开始查找

DFS_num(srcx,ttl,num2);


end


function plotButtonPushed3(btn3,num3)

%% 开始查找

DFS_num(srcx,ttl,num3);


end
DFS_num
function [] = DFS_num(r,ttl,num)% r:源节点
TTL:生存周期 num:邻居节点数

global neighborNodes1;%记录所有邻居节点数


global neighborNodes;%记录所需邻居节点数


neighborNodes1=find(distMatrix(r,:)<=radius);%查找在作用范围内的邻节点,选取目标节点与所有区域的距离且小于规定范围的节点


neighborNodes1=intersect(neighborNodes1,
find(visited(:) == 0));%找到可访问的 neighborNodes是列向量


%所有邻居节点

if(num==0)

neighborNodes=neighborNodes1;

end


%5个邻居节点,从所有邻居节点中选取5个

if(num==5)


neighborNodes=zeros(num,1);

for i=1:num

neighborNodes(i)=neighborNodes1(int32(1+(length(neighborNodes1)-1)*rand));


end

end


%3个邻居节点,从所有邻居节点中选取5个

if(num==3)


neighborNodes=zeros(num,1);

for i=1:num

neighborNodes(i)=neighborNodes1(int32(1+(length(neighborNodes1)-1)*rand));


end

end

end


