大数据 机器学习 分类算法
The roundup of most common classification algorithms along with their python and r code:
吨 他的Roundup与他们的Python和R代码一起最常见的分类算法:
Decision Tree, Naive Bayes, Gaussian Naive Bayes, Bernoulli Naive Bayes, Multinomial Naive Bayes, K Nearest Neighbours (KNN), Support Vector Machine (SVM), Linear Support Vector Classifier (SVC), Stochastic Gradient Descent (SGD) Classifier, Logistic Regression, Linear Discriminant Analysis (LDA), Quadratic Discriminant Analysis (QDA), Fisher’s Linear Discriminant….
决策树,朴素贝叶斯,高斯朴素贝叶斯,伯努利朴素贝叶斯,多项式朴素贝叶斯,K最近邻(KNN),支持向量机(SVM),线性支持向量分类器(SVC),随机梯度下降(SGD)分类器,对数回归,线性判别分析(LDA),二次判别分析(QDA),费舍尔线性判别 …。
Classification algorithms can be performed on a variety of data — structured and unstructured data. Classification is a technique where we divide the data into a given number of classes. The main goal of a classification problem is to identify the category or class to which a new data will fall under.
分类算法可以对多种数据(结构化和非结构化数据)执行。 分类是一种将数据划分为给定数量的类的技术。 分类问题的主要目标是确定新数据所属的类别或类别。
Important Terminologies encounter in machine learning — classification algorithms:
机器学习中遇到的重要术语-分类算法:
classifier: An algorithm that maps the input data to a specific category.
分类器 :一种将输入数据映射到特定类别的算法。
classification: A model draw some conclusion from input data which is given for training purpose. It will predict class labels or categories for new data.
分类 :模型从输入数据得出一些结论,这些结论是出于培训目的而给出的。 它将预测新数据的类别标签或类别。
Binary classification: Classification task with two possible outcomes. Eg: Gender classification (Male / Female)
二进制分类 :具有两个可能结果的分类任务。 例如:性别分类(男/女)
Multi-class classification: Classification with more than two classes. In multi-class classification, we assigned each sample to one and only one target label. Eg: An animal can be cat or dog but not both at the same time
多类分类:具有两个以上类的分类 。 在多类别分类中,我们将每个样本分配给一个且只有一个目标标签。 例如:动物可以是猫或狗,但不能同时是两者
Multi-label classification: Classification task where each sample is mapped to a set of target labels (more than one class). Eg: A news article may be about sport, a person, and location at the same time.
多标签分类 :将每个样本映射到一组目标标签(一个以上类别)的分类任务。 例如:新闻文章可能同时涉及体育,人物和位置。
Any of these classification algorithms can be used to build a model that predicts the outcome class or categories for a given dataset. The datasets can come from a variety of domains. Depending upon the dimensionality of the dataset, the attribute types, sparsity, and missing values, etc. one algorithm maybe give you better predictive accuracy than most others. Let’s briefly discuss these algorithms.
这些分类算法中的任何一种都可用于构建预测给定数据集的结果类或类别的模型。 数据集可以来自多种领域。 取决于数据集的维数,属性类型,稀疏性和缺失值等。一种算法可能比大多数算法提供更好的预测准确性。 让我们简要地讨论这些算法。
1.决策树 (1. Decision Tree)
Decision trees are very extremely intuitive ways to classify or label objects: you simply ask a series of questions designed to zero in on the classification. For example, if you wanted to build a decision tree to classify an animal you come across while on a hike, you might construct the one shown in Figure.
d ecision树是非常非常直观的方式来分类或标签对象:你只是问了一系列的分类设计为零的问题。 例如,如果您想构建一个决策树以对您在远足时遇到的动物进行分类,则可以构建如图所示的动物。
Decision tree classification models can easily handle qualitative independent variables without the need to create dummy variables. Missing values are not a problem either. Interestingly, decision tree algorithms can be used for regression models as well. The same library that you used to build a classification model, can also be used to build a regression model after change ing some of the parameters.
决策树分类模型可以轻松处理定性自变量,而无需创建虚拟变量。 缺少值也不是问题。 有趣的是,决策树算法也可以用于回归模型。 更改某些参数后,也可以使用用于构建分类模型的相同库来构建回归模型。
As the decision tree-based classification models are easy to interpret, they are not robust. One major problem with decision trees is their high variance or low bias. One small change in the training dataset can give an entirely different decision tree model.
由于基于决策树的分类模型易于解释,因此不可靠。 决策树的一个主要问题是它们的高方差或低偏差。 训练数据集中的一个小变化可以提供完全不同的决策树模型。
R tutorial
R教程
Python tutorial
Python教程
2.朴素贝叶斯 (2. Naive Bayes)
Naive Bayes models are a group of extremely fast and simple classification algorithms that are often suitable for very high-dimensional datasets. Because they are so fast and have so few tunable parameters, they end up being very useful as a quick-and-dirty baseline for a classification problem.
Ñaive贝叶斯模型是一组非常快速和简单的分类算法,往往适用于非常高维数据集。 因为它们是如此之快并且具有很少的可调参数,所以它们最终对于分类问题的快速和肮脏的基线非常有用。
Naive Bayes Classifier is based on the Bayes Theorem.
朴素贝叶斯分类器基于贝叶斯定理。
The Bayes Theorem says the conditional probability of an outcome can be computed using the conditional probability of the cause of the outcome.
贝叶斯定理说,可以使用结果原因的条件概率来计算结果的条件概率。
The probability of an event x occurring, given that event C has occurred in the prior probability. It is the knowledge that something has already happened. Using the prior probability, we can compute the posterior probability — which is the probability that event C will occur given that x has occurred. The Naive Bayes classifier uses the input variable to choose the class with the highest posterior probability.
给定事件C已发生在先验概率中 ,则事件x发生的概率。 据了解已经发生了一些事情。 使用先验概率,我们可以计算后验概率,这是在发生x的情况下事件C发生的概率。 朴素贝叶斯分类器使用输入变量来选择具有最高后验概率的类。
The algorithm is called naive because it makes an assumption about the distribution of the data. The distribution can be Gaussian, Bernoulli, or Multinomial. Another drawback of Naive Bayes is that continuous variables have to be preprocessed and discretized by binning, which can discard useful information.
该算法之所以称为朴素,是因为它假设了数据的分布。 分布可以是高斯分布,伯努利分布或多项式分布。 朴素贝叶斯的另一个缺点是连续变量必须通过合并进行预处理和离散化,这会丢弃有用的信息。
Tutorial
讲解
R Tutorial
R教程
Python Tutorial
Python教程
3.高斯朴素贝叶斯 (3. Gaussian Naive Bayes)
The Gaussian Naive Bayes algorithm assumes that all the features have a Gaussian (Normal / Bell Curve) distribution. This is suitable for continuous data eg: daily temperature, height.
吨他高斯朴素贝叶斯算法假设所有的功能具有高斯(正常/钟形曲线)分布。 这适用于连续数据,例如:每日温度,身高。
The Gaussian distribution has 68% of the data in 1 standard deviation of the mean and 96% within 2 standard deviations. Data that is not normally distributed produce low accuracy when used in a Gaussian Naive Bayes classifier and a Naive Bayes classifier with a different distribution can be used.
高斯分布在平均值的1个标准偏差中具有68%的数据,在2个标准偏差内具有96%的数据。 当在高斯朴素贝叶斯分类器和具有不同分布的朴素贝叶斯分类器中使用时,非正态分布的数据产生的准确性较低。
Python Tutorial
Python教程
R Tutorial
R教程
4.伯努利·朴素贝叶斯 (4. Bernoulli Naive Bayes)
The Bernoulli Distribution is used for binary variables — variables that can have 1 of 2 values. It denotes the probability of each of the variables occurring. A Bernoulli Naive Bayes classifier is appropriate for binary variables, like Gender or Deceased.
Bernoulli分布用于二进制变量,即可以具有2个值中的1个的变量。 它表示每个变量出现的概率。 Bernoulli Naive Bayes分类器适用于二进制变量,例如Gender或Deceased。
Python Tutorial
Python教程
R Tutorial
R教程
5.多项朴素贝叶斯 (5. Multinomial Naive Bayes)
The Multinomial Naive Bayes uses the multinomial distribution, which is the generalization of the binomial distribution. In other words, the multinomial distribution models the probability of rolling a k sided die n times.
多项式朴素贝叶斯使用多项式分布,这是二项式分布的推广。 换句话说,多项式分布模拟了将k边模具滚动n次的概率。
Multinomial Naive Bayes is used frequently in text analytics because it has a bag of words assumption — which is the position of the words doesn’t matter. It also has an independence assumption — that the features are all independent.
多项式朴素贝叶斯在文本分析中经常使用,因为它有一个单词假设袋-单词的位置无关紧要。 它还有一个独立性假设-这些功能都是独立的。
Python Tutorial
Python教程
R Tutorial
R教程
6. K最近的邻居(KNN) (6. K Nearest Neighbours (KNN))
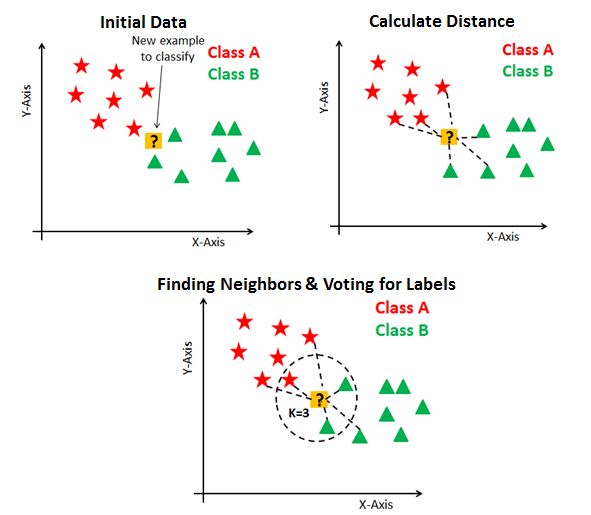
K Nearest Neighbors is the simplest machine learning algorithm. The idea is to memorize the entire dataset and classify a point based on the class of its K nearest neighbors.
K最近邻居是最简单的机器学习算法。 想法是记住整个数据集,并根据其K个最近邻居的类别对一个点进行分类。
The figure from Understanding Machine Learning, by Shai Shalev-Shwartz and Shai Ben-David, shows the boundaries in which a label point will be predicted to have the same class as the point already in the boundary. This is a 1 Nearest Neighbor, the class of only 1 nearest neighbor is used.
Shai Shalev-Shwartz和Shai Ben-David的《理解机器学习》中的图显示了边界,其中标签点将被预测为与该边界中的点具有相同的类。 这是1个最近邻居,仅使用1个最近邻居的类。
KNN is simple and without any assumptions, but the drawback of the algorithm is that it is slow and can become weak as the number of features increase. It is also difficult to determine the optimal value of K — which is the number of neighbors used.
KNN很简单,没有任何假设,但是该算法的缺点是速度慢,并且随着特征数量的增加而变弱。 确定K的最佳值也很困难,K的最佳值是所使用的邻居数。
R Tutorial
R教程
Python Tutorial
Python教程
7.支持向量机(SVM) (7. Support Vector Machine (SVM))
An SVM is a classification and regression algorithm. It works by identifying a hyperplane that separates the classes in the data. A hyperplane is a geometric entity which has a dimension of 1 less than it’s surrounding (ambient) space.
一个 SVM是分类和回归算法。 它通过识别将数据中的类分开的超平面来工作。 超平面是一个几何实体,其尺寸比其周围(环境)空间小1。
If SVM is asked to classify a two-dimensional dataset, it will do it with a one-dimensional hyper place (a line), classes in 3D data will be separated by a 2D plane and Nth dimensional data will be separated by an N-1 dimension line.
如果要求SVM对二维数据集进行分类,它将使用一维超位置(一条线)进行处理,3D数据中的类将由2D平面分隔,第N维数据将由N-分隔。 1个尺寸线。
SVM is also called a margin classifier because it draws a margin between classes.
SVM也称为边距分类器,因为它在类之间绘制边距 。
The images shown here has a class that is linearly separable. However, sometimes classes cannot be separated by a straight line in the present dimension. An SVM is capable of mapping the data in a higher dimension such that it becomes separable by a margin.
此处显示的图像具有线性可分离的类别。 但是,有时在当前维度上类不能用直线分隔。 SVM能够以更高的维度映射数据,以使数据之间有一定的间隔。
Support Vector machines are powerful in situations where the number of features (columns) is more than the number of samples (rows). It is also effective in high dimensions (such as images). It is also memory efficient because it uses a subset of the dataset to learn support vectors.
在特征(列)数量大于样本(行)数量的情况下,支持向量机功能强大。 在高尺寸(例如图像)中也有效。 由于它使用数据集的子集来学习支持向量,因此它也具有存储效率。
- Python Tutorial Python教程
- R Tutorial R教程
8.线性支持向量分类器(SVC) (8. Linear Support Vector Classifier (SVC))
A Linear SVC uses a boundary of one-degree (linear/straight line) to classify data. Linear SVC has much less complexity than a non-linear classifier and is only appropriate for small datasets. More complex datasets will require a nonlinear classifier.
线性SVC使用一度边界(线性/直线)对数据进行分类。 线性SVC的复杂度远低于非线性分类器,并且仅适用于小型数据集。 更复杂的数据集将需要非线性分类器。
Python Tutorial
Python教程
R Tutorial
R教程
9.随机梯度下降(SGD)分类器 (9. Stochastic Gradient Descent (SGD) Classifier)
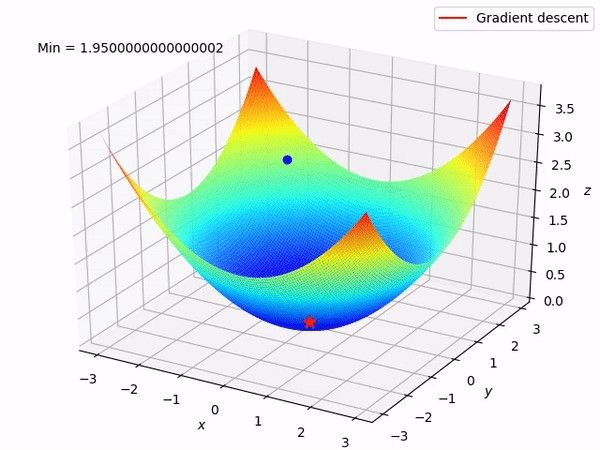
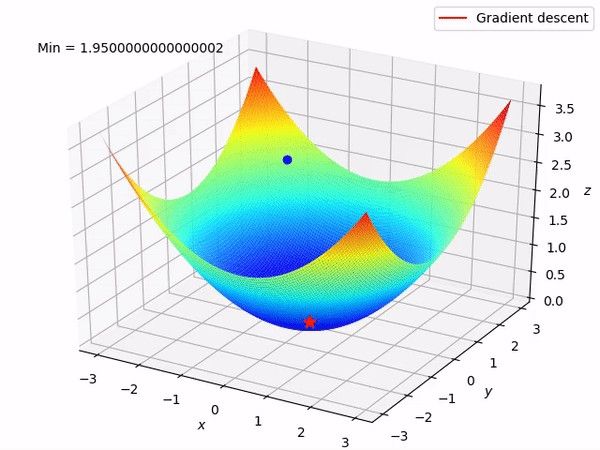
SGD is a linear classifier that computes the minima of the cost function by computing the gradient at each iteration and updating the model with a decreasing rate. It is an umbrella term for many types of classifiers, such as Logistic Regression or SVM that use the SGD technique for optimization.
SGD是线性分类器,它通过计算每次迭代的梯度并以递减的速率更新模型来计算成本函数的最小值。 它是许多类型的分类器的总称,例如使用SGD技术进行优化的Logistic回归或SVM。
Python Tutorial
Python教程
R Tutorial
R教程
10. Logistic回归 (10. Logistic Regression)
Logistic regression estimates the relationship between a dependent categorical variable and independent variables. For instance, to predict whether an email is a spam or whether the tumor is malignant or not.
大号 ogistic回归估计从属分类变量和自变量之间的关系。 例如,预测电子邮件是否为垃圾邮件或肿瘤是否为恶性肿瘤。
If we use linear regression for this problem, there is a need to set up a threshold for classification which generates inaccurate results. Besides this, linear regression is unbounded, and hence we go into the idea of logistic regression.
如果我们对这个问题使用线性回归,则需要设置一个分类阈值,以产生不准确的结果。 除此之外,线性回归是无限的,因此我们进入了逻辑回归的思想。
Unlike linear regression, logistic regression is estimated using the Maximum Likelihood Estimation (MLE) approach. MLE is a technique for the “likelihood” maximization method, while OLS is a distance-minimizing approximation method. Maximizing the likelihood function determines the mean and variance parameters that are most likely to produce the observed data.
与线性回归不同,逻辑回归是使用最大似然估计(MLE)方法估计的。 MLE是“似然性”最大化方法的一种技术,而OLS是一种距离最小化的近似方法。 最大化似然函数可确定最有可能产生观测数据的均值和方差参数。
Logistic Regression transforms its output using the sigmoid function in the case of binary logistic regression. As you can see in the below figure, if ‘t’ goes to infinity, Y (predicted) will become 1 and if ‘t’ goes to negative infinity, Y(predicted) will become 0. The output from the function is the estimated probability. This is used to infer how confident can predicted value be as compared to the actual value when given an input X.
在二进制逻辑回归的情况下,逻辑回归使用Sigmoid函数转换其输出。 如下图所示,如果' t '变为无穷大,则Y (预测)将变为1,如果' t '变为负无穷大,则Y (预测)将变为0。该函数的输出为估计值。可能性。 这用于推断给定输入X时,预测值与实际值相比的置信度。
There are several types of logistic regression:
逻辑回归有几种类型:
Binary Logistic Regression: Two Categories: Spam (1) Not-Spam (0)
二进制Logistic回归:两种类别:垃圾邮件(1)非垃圾邮件(0)
Multinomial Logistic Regression: Three or more category without ordering: Predicts which food is recommended more like Veg, Non-Veg, Vegan
多项式Logistic回归:不需排序的三个或更多类别:预测推荐哪种食物,例如蔬菜,非蔬菜,素食主义者
Ordinal Logistic Regression: Three or more categories with ordering: Books rating from 1 to 5
顺序Logistic回归:具有排序的三个或更多类别:图书评分从1到5
Python Tutorial
Python教程
R Tutorial
R教程
11.线性判别分析(LDA) (11. Linear Discriminant Analysis (LDA))
Linear Discriminant Analysis (LDA) is performed by starting with 2 classes and generalizing to more. The idea is to find a direction, defined by a vector, such that when the two classes are projected on the vector, they are as spread out as possible.
大号 inear判别分析(LDA)是通过用2班开始和推广到更进行。 这个想法是找到一个由向量定义的方向,这样当两个类投影到向量上时 ,它们将尽可能分散。
Python Tutorial
Python教程
R Tutorial
R教程
Vector Source: Ethem Alpaydin
矢量图来源:以太Alpaydin
12.二次判别分析(QDA) (12. Quadratic Discriminant Analysis (QDA))
QDA is the same concept as LDA, the only difference is that we do not assume the distribution within the classes is
QDA与LDA的概念相同,唯一的区别是我们不假定类内的分布是
normal. Therefore, a different covariance matrix has to be built for each class which increases the computational cost because there are more parameters to estimate, but it fits data better than LDA.
正常。 因此,必须为每个类别建立不同的协方差矩阵,这会增加计算成本,因为要估计的参数更多,但比LDA更好地拟合了数据。
Python Tutorial
Python教程
R Tutorial
R教程
13. Fisher线性判别式 (13. Fisher’s Linear Discriminant)
Fisher’s Linear Discriminant improves upon LDA by maximizing the ratio between-class variance and the inter-class variance. This reduces the loss of information caused by overlapping classes in LDA.
˚F isher的线性判别通过最大化比类间方差和类间方差改进了LDA。 这样可以减少由于LDA中的类重叠造成的信息丢失。
Python Tutorial
Python教程
R Tutorial
R教程
Thanks for reading.
谢谢阅读。
翻译自: https://medium.com/@bhanwar8302/13-machine-learning-classification-algorithms-for-data-science-and-their-code-e185e8fca507
大数据 机器学习 分类算法


