python:激活函数及其导数画图sigmoid/tanh/relu/Leakyrelu/swish/hardswish/hardsigmoid
from matplotlib import pyplot as plt
import numpy as np
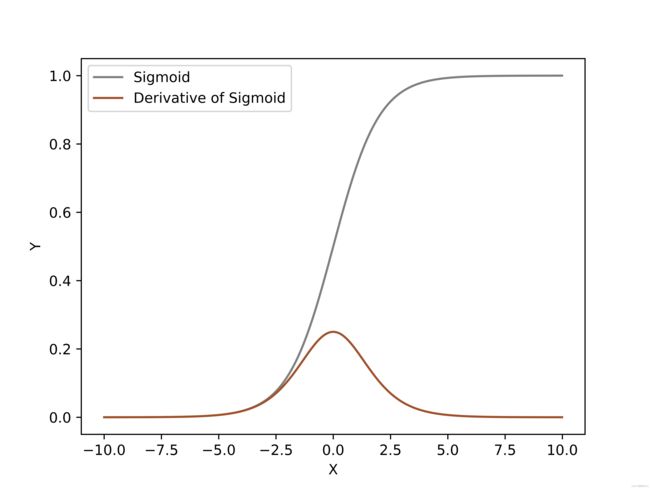
def sigmoid(x):
return 1 / (1 + np.exp(-x))
def dx_sigmoid(x):
return sigmoid(x) * (1 - sigmoid(x))
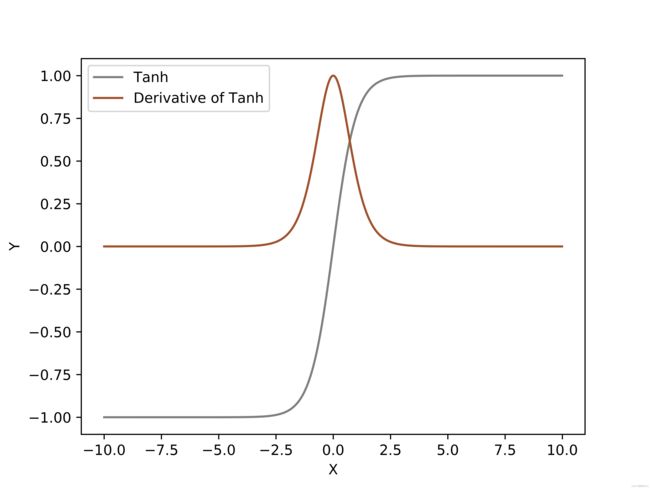
def tanh(x):
return (np.exp(x)-np.exp(-x))/(np.exp(x)+np.exp(-x))
def dx_tanh(x):
return 1-tanh(x)*tanh(x)
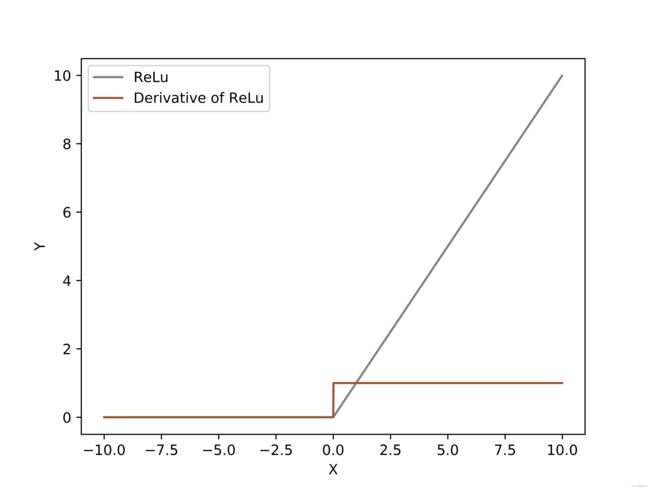
def relu(x):
return np.maximum(0,x)#np.where(x < 0, 0, x)
def dx_relu(x):
return np.where(x < 0, 0, 1)
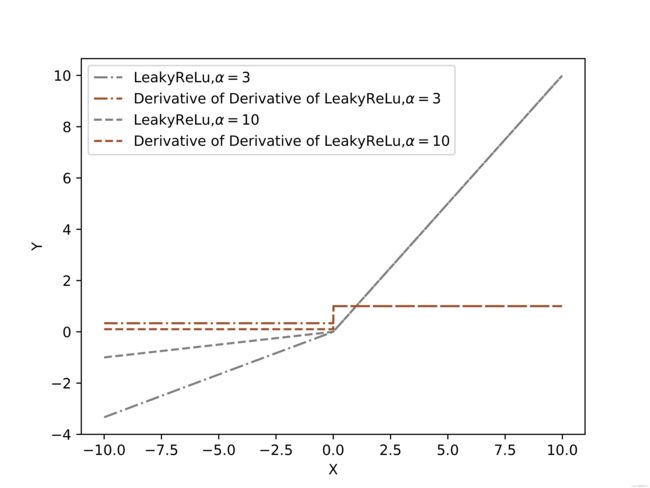
def Leaky_relu(x,alpha):# a大于1,指定a
return np.where(x<0,x/alpha,x)#np.maximum(x/alpha,x) #np.where(x<0,x/alpha,x)
def dx_Leaky_relu(x,alpha):
return np.where(x < 0, 1/alpha, 1)
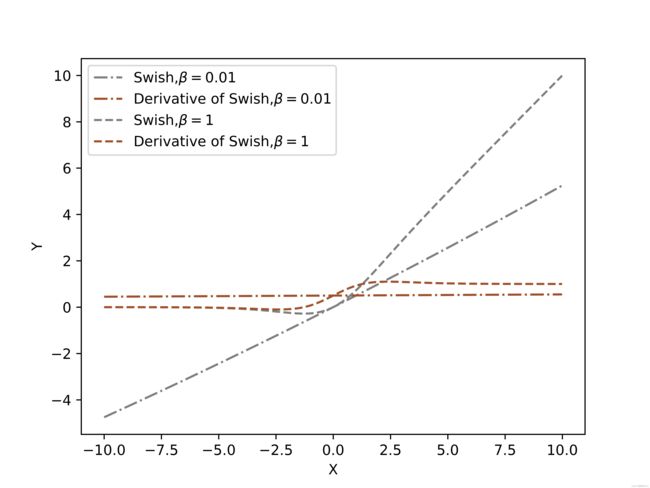
def swish(x,b):
return x * (np.exp(b * x) / (np.exp(b * x) + 1)) #sigmoid(bx) * x
def dx_swish(x,b):
return np.exp(b*x)/(1+np.exp(b*x)) + x * (b*np.exp(b*x) / ((1+np.exp(b*x))*(1+np.exp(b*x))))#sigmoid(bx)+sigmoid(bx)*b*x
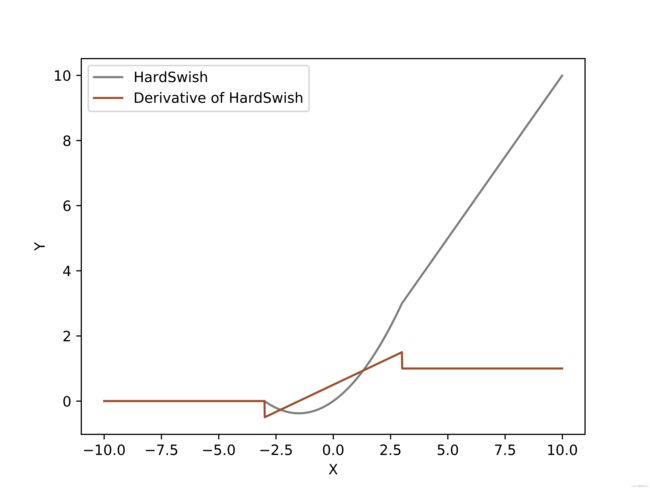
def hard_swish(x):
f = x + 3
relu6 = np.where(np.where(f < 0, 0, f) > 6, 6, np.where(f < 0, 0, f))
return x * relu6 / 6
def dx_hard_swish(x):
f = x + 3
relu6 = np.where(np.where(f < 0, 0, f) > 6, 6, np.where(f < 0, 0, f))
relu6_grad = np.where(f > 6, 0, np.where(f < 0, 0, 1))
return relu6 / 6 + x * relu6_grad / 6
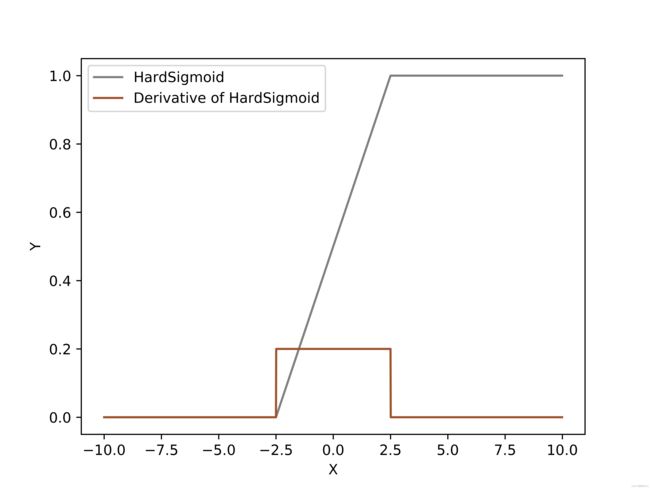
def hard_sigmoid(x):
f = (2 * x + 5) / 10
return np.where(np.where(f > 1, 1, f) < 0, 0, np.where(f > 1, 1, f))
def dx_hard_sigmoid(x):
f = (2 * x + 5) / 10
return np.where(f > 0, np.where(f >= 1, 0, 1 / 5), 0)
if __name__ == '__main__':
###1#####
x = np.arange(-10, 10, 0.01)
fz = sigmoid(x)
d_fz = dx_sigmoid(x)
plt.xlabel('X')
plt.ylabel('Y')
plt.plot(x, fz, color='grey',label='Sigmoid')
plt.plot(x, d_fz,color='sienna',label='Derivative of Sigmoid')
plt.legend()
plt.savefig("Sigmoid.png", dpi=1000, format='png')
plt.show()
###2#####
y = np.arange(-10, 10, 0.01)
fz = tanh(y)
d_fz = dx_tanh(y)
plt.xlabel('X')
plt.ylabel('Y')
plt.plot(y, fz, color='grey',label='Tanh')
plt.plot(y, d_fz,color='sienna',label='Derivative of Tanh')
plt.legend()
plt.savefig("Tanh.png", dpi=1000, format='png')
plt.show()
###3#####
z = np.arange(-10, 10, 0.01)
fz = relu(z)
d_fz = dx_relu(z)
plt.xlabel('X')
plt.ylabel('Y')
plt.plot(z, fz, color='grey',label='ReLu')
plt.plot(z, d_fz,color='sienna',label='Derivative of ReLu')
plt.legend()
plt.savefig("ReLu.png", dpi=1000, format='png')
plt.show()
###4#####
p = np.arange(-10, 10, 0.01)
fz = Leaky_relu(p,alpha=3)
d_fz = dx_Leaky_relu(p,alpha=3)
fx = Leaky_relu(p, alpha=10)
d_fx = dx_Leaky_relu(p, alpha=10)
plt.xlabel('X')
plt.ylabel('Y')
plt.plot(p, fz, color='grey',linestyle='-.',label=r"LeakyReLu,$\alpha={0}$".format(3))
plt.plot(p, d_fz,color='sienna',linestyle='-.',label=r"Derivative of Derivative of LeakyReLu,$\alpha={0}$".format(3))
plt.plot(p, fx, color='grey', linestyle='--',label=r"LeakyReLu,$\alpha={0}$".format(10))
plt.plot(p, d_fx, color='sienna',linestyle='--', label=r"Derivative of Derivative of LeakyReLu,$\alpha={0}$".format(10))
plt.legend()
plt.savefig("LeakyReLu.png", dpi=1000, format='png') ###########保存原始图片
plt.show()
###5#####
g = np.arange(-10, 10, 0.01)
fz = swish(g,b=0.01)
d_fz = dx_swish(g,b=0.01)
fy = swish(g,b=1)
d_fy = dx_swish(g,b=1)
plt.xlabel('X')
plt.ylabel('Y')
plt.plot(g, fz, color='grey',linestyle='-.',label=r"Swish,$\beta={0}$".format(0.01))
plt.plot(g, d_fz,color='sienna',linestyle='-.',label=r"Derivative of Swish,$\beta={0}$".format(0.01))
plt.plot(g, fy, color='grey', linestyle='--',label=r"Swish,$\beta={0}$".format(1))
plt.plot(g, d_fy, color='sienna', linestyle='--',label=r"Derivative of Swish,$\beta={0}$".format(1))
plt.legend()
plt.savefig("Swish.png", dpi=1000, format='png') ###########保存原始图片
plt.show()
###6#####
f = np.arange(-10, 10, 0.01)
fz = hard_swish(f)
d_fz = dx_hard_swish(f)
plt.xlabel('X')
plt.ylabel('Y')
plt.plot(f, fz, color='grey',label='HardSwish')
plt.plot(f, d_fz,color='sienna',label='Derivative of HardSwish')
plt.legend()
plt.savefig("HardSwish.png", dpi=1000, format='png')
plt.show()
###7#####
k = np.arange(-10, 10, 0.01)
fz = hard_sigmoid(k)
d_fz = dx_hard_sigmoid(k)
plt.xlabel('X')
plt.ylabel('Y')
plt.plot(k, fz, color='grey',label='HardSigmoid')
plt.plot(k, d_fz,color='sienna',label='Derivative of HardSigmoid')
plt.legend()
plt.savefig("HardSigmoid.png", dpi=1000, format='png')
plt.show()
1.
2
3
4
5
6
7