目录
-
- 1. 加载需要的包
- 2. 载入数据集
- 3. 搭建网络模型
- 4. 模型训练
- 5. 模型测试
- 6. 训练过程可视化
1. 加载需要的包
import tensorflow as tf
from tensorflow import keras
from tensorflow.keras import layers, optimizers, losses, datasets, Sequential
from tensorflow.keras.datasets import mnist
from tensorflow.keras.layers import Dense, Dropout, Activation, Flatten, Conv2D, MaxPooling2D, GlobalMaxPool2D
from tensorflow.keras.optimizers import RMSprop
import matplotlib.pyplot as plt
import numpy as np
2. 载入数据集
(x_train, y_train), (x_test, y_test) = mnist.load_data()
x_train = x_train.reshape(60000, 28, 28, 1)
x_test = x_test.reshape(10000, 28, 28, 1)
x_train = x_train.astype('float32')
x_test = x_test.astype('float32')
x_train /= 255
x_test /=255
y_train = keras.utils.to_categorical(y_train, num_classes=10)
y_test = keras.utils.to_categorical(y_test, num_classes=10)
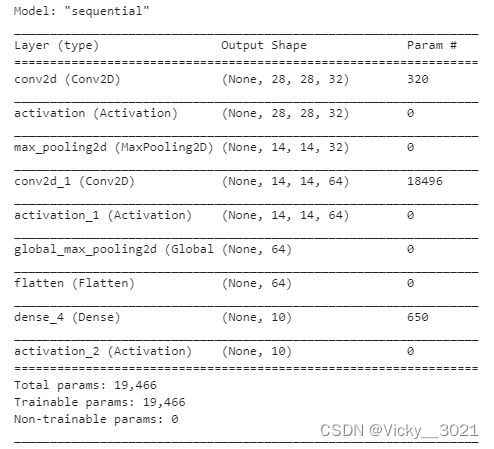
3. 搭建网络模型
model = Sequential()
model.add(Conv2D(32, (3, 3), padding='same',input_shape=x_train.shape[1:]))
model.add(Activation('relu'))
model.add(MaxPooling2D(pool_size=(2, 2)))
model.add(Conv2D(64, (3, 3), padding='same'))
model.add(Activation('relu'))
model.add(GlobalMaxPool2D())
model.add(Flatten())
model.add(Dense(10))
model.add(Activation('softmax'))
print(model.summary())
model.compile(loss='categorical_crossentropy', optimizer=RMSprop(), metrics=['accuracy'])
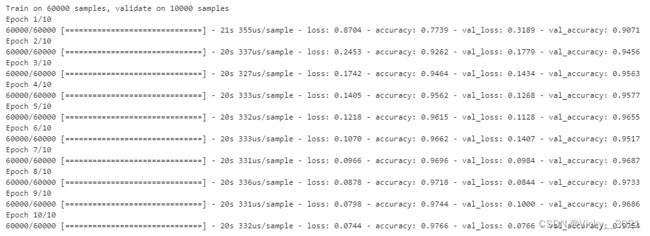
4. 模型训练
history = model.fit(x_train, y_train,
batch_size=128,
epochs=10,
verbose=1,
validation_data=(x_test, y_test))
5. 模型测试
score = model.evaluate(x_test, y_test, verbose=1)
print('Test loss:', score[0])
print('Test accuracy:', score[1])

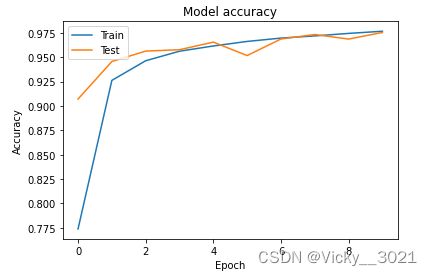
6. 训练过程可视化
plt.plot(history.history['accuracy'])
plt.plot(history.history['val_accuracy'])
plt.title('Model accuracy')
plt.ylabel('Accuracy')
plt.xlabel('Epoch')
plt.legend(['Train', 'Test'], loc='upper left')
plt.show()
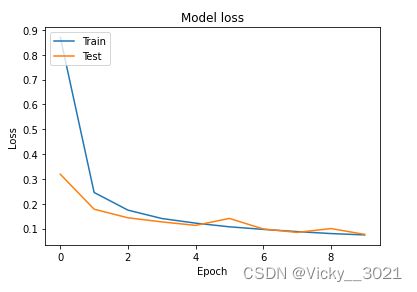
plt.plot(history.history['loss'])
plt.plot(history.history['val_loss'])
plt.title('Model loss')
plt.ylabel('Loss')
plt.xlabel('Epoch')
plt.legend(['Train', 'Test'], loc='upper left')
plt.show()