【突变检验方法一】MATLAB实现Pettitt突变检验
1 突变检验
突变分为如下主要的几种:均值突变(最常见)、方差突变、线性回归突变(也称趋势突变)、概率突变、空间型突变、谱突变、模型参数突变,等等。
2 Pettitt突变检验
2.1 原理
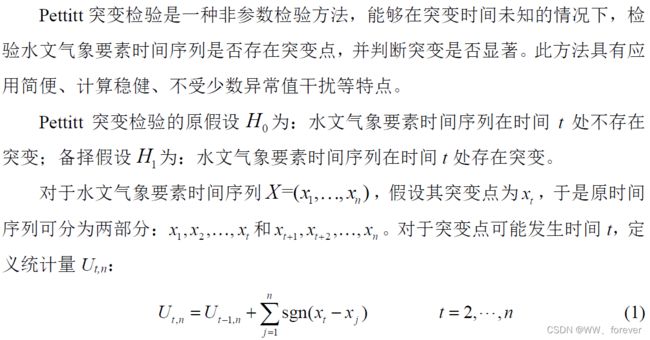
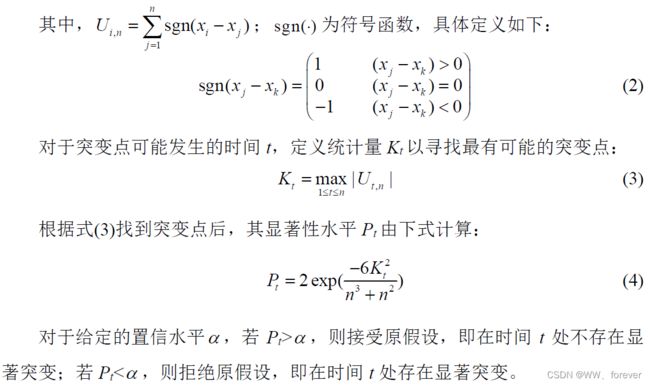
2.2 MATLAB相关代码
实现Pettitt突变检验的MATLAB代码如下:
function [Ut, kmax, changePoint , coef ] = PettittTest( X )
% 输入变量
% X   时间序列
% 输出变量
% changePoint     突变点
% coef    显著性水平Pt
n = length( X );
s = 0;
Ut =zeros(n-1,1);
for i=1:n-1
    for j=i+1:n
        s = s +sign( X(i) - X(j) );
    end
    Ut(i) = s;
end

kmax = max( abs(Ut) );                                % 找到最可能突变点
changePoint = find( abs(Ut) == kmax );      % 找出最大值对应的序列号
coef = 2*exp( -6*kmax^2/(n^3+n^2) );     % 检验其P值情况,统计学认为P<0.5采用统计意义
%{
% 画图
figure(1)
hold on;box on;
h(1) = plot(Ut,'k-','linewidth',1.5);   % 整个曲线的变化趋势
h(2) = plot( [changePoint,changePoint] , [-kmax,kmax], 'r--','linewidth',1.5);
klim = kmax - kmax*0.1;
h(3) = plot([1,n],[-klim,-klim],'b-.','linewidth',1.5);
h(4) = plot([1,n],[klim,klim],'b-.','linewidth',1.5);
%}
end
另:
MATLAB函数:
% This code is used to find the change point in a univariate continuous time series
% using Pettitt Test.
%
%
% The test here assumed is two-tailed test. The hypothesis are as follow:
%  H (Null Hypothesis): There is no change point in the series
%  H(Alternative Hypothesis): There is a change point in the series
%
% Input: univariate data series
% Output:
% The output of the answer in row wise respectively,
% loc: location of the change point in the series, index value in
% the data set
% K: Pettitt Test Statistic for two tail test
% pvalue: p-value of the test
%
%Reference: Pohlert, Thorsten. "Non-Parametric Trend Tests and Change-Point Detection." (2016).
%

function a=pettitt(data)
[m n]=size(data);
for t=2:1:m
    for j=1:1:m
      v(t-1,j)=sign(data(t-1,1)-data(j,1));
      V(t-1)=sum(v(t-1,:));
    end
end

U=cumsum(V);
loc=find(abs(U)==max(abs(U)));
K=max(abs(U));
pvalue=2*exp((-6*K^2)/(m^3+m^2));
a=[loc; K ;pvalue];
return
函数调用:
a=pettitt(y);
2.3 案例
调用函数代码如下:
clc
close all
clear
%%
load('X.mat');
[Ut, kmax,changePoint , coef ] = PettittTest( X );


figure(2)
hold on;box on;
h(1) = plot(X,'k-','linewidth',1.5);   %  原数据
h(2) = plot( [changePoint,changePoint] , [X(changePoint)-X(changePoint)*0.1,X(changePoint)+X(changePoint)*0.1], 'r--','linewidth',1.5);
xlabel("序列");
ylabel("X");
set(gca,'Layer','top','FontSize',12,'Fontname', 'Times New Roman');
统计量示意图如下:

原数据示意图如下:

参考
1.代码参考-MATLAB实现pettitt检验
2.文献-J1979-A Non-Parametric Approach to the Change-Point Problem