第一个:
import numpy as np
import matplotlib.pyplot as plt
from sklearn import manifold, datasets
digits = datasets.load_digits(n_class=6)
X, y = digits.data, digits.target
n_samples, n_features = X.shape
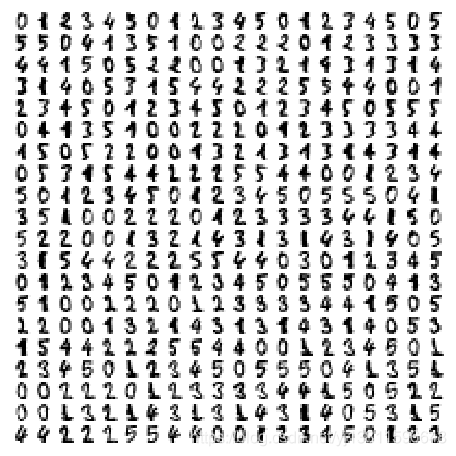
'''显示原始数据'''
n = 20
img = np.zeros((10 * n, 10 * n))
for i in range(n):
ix = 10 * i + 1
for j in range(n):
iy = 10 * j + 1
img[ix:ix + 8, iy:iy + 8] = X[i * n + j].reshape((8, 8))
plt.figure(figsize=(8, 8))
plt.imshow(img, cmap=plt.cm.binary)
plt.xticks([])
plt.yticks([])
plt.show()
type(X)
numpy.ndarray
X[0]
array([ 0.,  0.,  5., 13.,  9.,  1.,  0.,  0.,  0.,  0., 13., 15., 10.,
       15.,  5.,  0.,  0.,  3., 15.,  2.,  0., 11.,  8.,  0.,  0.,  4.,
       12.,  0.,  0.,  8.,  8.,  0.,  0.,  5.,  8.,  0.,  0.,  9.,  8.,
        0.,  0.,  4., 11.,  0.,  1., 12.,  7.,  0.,  0.,  2., 14.,  5.,
       10., 12.,  0.,  0.,  0.,  0.,  6., 13., 10.,  0.,  0.,  0.])
X.size
69312
X.shape
(1083, 64)
print(n_samples, n_features)
1083 64
'''t-SNE'''
tsne = manifold.TSNE(n_components=2, init='pca', random_state=501)
X_tsne = tsne.fit_transform(X)
print("Org data dimension is {}.Embedded data dimension is {}".format(X.shape[-1], X_tsne.shape[-1]))
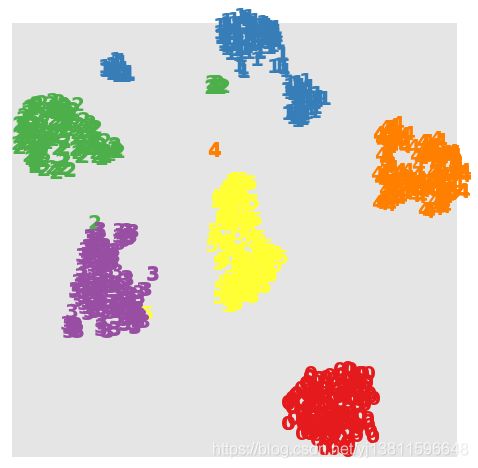
'''嵌入空间可视化'''
x_min, x_max = X_tsne.min(0), X_tsne.max(0)
X_norm = (X_tsne - x_min) / (x_max - x_min)
plt.figure(figsize=(8, 8))
for i in range(X_norm.shape[0]):
plt.text(X_norm[i, 0], X_norm[i, 1], str(y[i]), color=plt.cm.Set1(y[i]),
fontdict={'weight': 'bold', 'size': 20})
plt.xticks([])
plt.yticks([])
plt.show()
Org data dimension is 64.Embedded data dimension is 2
第二个:
import pandas as pd
inputfile = r'consumption_data.xls'
k = 3
iteration = 500
data = pd.read_excel(inputfile, index_col = 'Id')
data_zs = 1.0*(data - data.mean())/data.std()
type(data_zs)
pandas.core.frame.DataFrame
print(data_zs.index)
Int64Index([  1,   2,   3,   4,   5,   6,   7,   8,   9,  10,
            ...
            933, 934, 935, 936, 937, 938, 939, 940, 941, 942],
           dtype='int64', name='Id', length=940)
print(data_zs.columns)
Index(['R', 'F', 'M'], dtype='object')
print(data_zs[0:3])
           R         F         M
Id
1   0.764186 -0.493579 -1.158711
2  -1.024757 -0.630079  0.622527
3  -0.950217  0.871423 -0.341103
from sklearn.cluster import KMeans
model = KMeans(n_clusters = k, n_jobs = 4, max_iter = iteration)
model.fit(data_zs)
r1 = pd.Series(model.labels_).value_counts()
r1
0    559
1    341
2     40
dtype: int64
r2 = pd.DataFrame(model.cluster_centers_)
r2
|
0 |
1 |
2 |
| 0 |
-0.149353 |
-0.658893 |
-0.271780 |
| 1 |
-0.160451 |
1.114802 |
0.392844 |
| 2 |
3.455055 |
-0.295654 |
0.449123 |
r = pd.concat([r2, r1], axis = 1)
r
|
0 |
1 |
2 |
0 |
| 0 |
-0.149353 |
-0.658893 |
-0.271780 |
559 |
| 1 |
-0.160451 |
1.114802 |
0.392844 |
341 |
| 2 |
3.455055 |
-0.295654 |
0.449123 |
40 |
r.columns = list(data.columns) + [u'类别数目']
print(r)
          R         F         M  类别数目
0 -0.149353 -0.658893 -0.271780   559
1 -0.160451  1.114802  0.392844   341
2  3.455055 -0.295654  0.449123    40
type(model)
sklearn.cluster.k_means_.KMeans
model[0]
---------------------------------------------------------------------------

TypeError                                 Traceback (most recent call last)

 in ()
----> 1 model[0]


TypeError: 'KMeans' object does not support indexing
type(model.labels_)
numpy.ndarray
model.labels_.size
940
model.cluster_centers_
array([[-0.14935336, -0.65889299, -0.27177977],
       [-0.16045063,  1.11480154,  0.39284443],
       [ 3.45505486, -0.29565357,  0.44912342]])
outputfile = 'data_type.xls'
r = pd.concat([data, pd.Series(model.labels_, index = data.index)], axis = 1)
r.columns = list(data.columns) + [u'聚类类别']
r.to_excel(outputfile)
data_out = pd.read_excel(outputfile, index_col = 'Id')
print(data_out[0:3])
     R   F        M  聚类类别
Id
1   27   6   232.61     0
2    3   5  1507.11     0
3    4  16   817.62     1
from sklearn.manifold import TSNE
tsne = TSNE()
tsne.fit_transform(data_zs)
tsne = pd.DataFrame(tsne.embedding_, index = data_zs.index)
import matplotlib.pyplot as plt
plt.rcParams['font.sans-serif'] = ['SimHei']
plt.rcParams['axes.unicode_minus'] = False
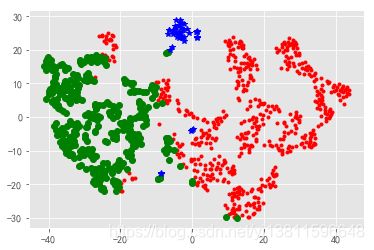
d = tsne[r[u'聚类类别'] == 0]
plt.plot(d[0], d[1], 'r.')
d = tsne[r[u'聚类类别'] == 1]
plt.plot(d[0], d[1], 'go')
d = tsne[r[u'聚类类别'] == 2]
plt.plot(d[0], d[1], 'b*')
plt.show()
print(tsne[0:3])
            0          1
Id
1   13.233582  22.531153
2   15.523943 -25.674824
3  -30.262331  11.098033
print(tsne.index.size)
940
r[0:3]
|
R |
F |
M |
聚类类别 |
| Id |
|
|
|
|
| 1 |
27 |
6 |
232.61 |
0 |
| 2 |
3 |
5 |
1507.11 |
0 |
| 3 |
4 |
16 |
817.62 |
1 |
d = tsne[r[u'聚类类别'] == 0]
d[0:3]
|
0 |
1 |
| Id |
|
|
| 1 |
13.233582 |
22.531153 |
| 2 |
15.523943 |
-25.674824 |
| 4 |
-24.099859 |
24.144758 |
d.index.size
559
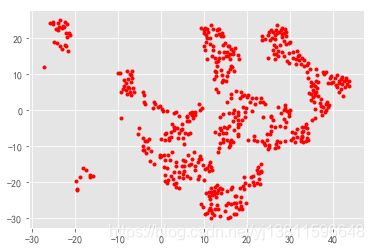
plt.plot(d[0], d[1], 'r.')
[]
d1 = tsne[r[u'聚类类别'] == 1]
plt.plot(d1[0], d1[1], 'go')
[]
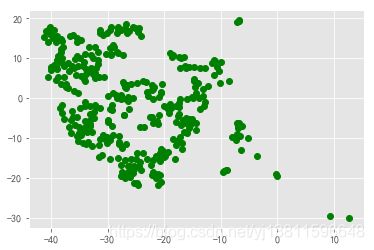
d = tsne[r[u'聚类类别'] == 0]
plt.plot(d[0], d[1], 'r.')
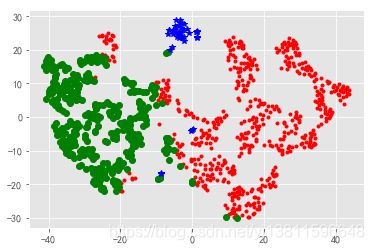
d = tsne[r[u'聚类类别'] == 1]
plt.plot(d[0], d[1], 'go')
d = tsne[r[u'聚类类别'] == 2]
plt.plot(d[0], d[1], 'b*')
plt.show()
第二个例子来源于,张良均等著《python数据分析与挖掘实战》


