python xgboost建模过程_机器学习——XGBoost大杀器,XGBoost模型原理,XGBoost参数含义...
0.随机森林的思考
随机森林的决策树是分别采样建立的,各个决策树之间是相对独立的。那么,在我们得到了第k-1棵决策树之后,能否通过现有的样本和决策树的信息, 对第m颗树的建立产生有益的影响呢?在随机森林建立之后,采用的投票过程能否增加一定的权值呢?在选取样本的时候,我们能否对于分类错误的样本给予更大的权值,使之得到更多的重视呢?
1.什么是提升思想
提升是一个机器学习技术,可以用于回归和分类问题,它每一步产生一个弱预测模型,并加权累加到总的模型之中,如果每一步的弱预测模型生成都是依据损失函数的梯度方向,则称之为梯度提升。
梯度提升算法首先给定一个目标损失函数,它的定义域是所有可行的弱函数集合(基函数);提升算法通过迭代的选择一个负梯度方向上的基函数来逐渐毕竟局部极小值。这种在函数域的梯度提升观点在机器学习的很多领域都用较大的影响。
提升的理论意义是:如果一个问题存在弱分类器,则可以通过提升的办法得到强分类器。
2.提升算法
给定输入向量X和输出变量y组成的若干训练样本,(x1,y1),(x2,y2),.....,(xn,yn),目标是找到近似函数F(x),使得损失函数L(y,F(x))的损失值最小。
损失函数的经典定义:
假定最优函数为F*(x),即:
假定F(x)是一族基函数fi(x)的加权和
那么,对于上述的F(x),我们应该如何求解呢?
我们很容易想到贪心的思路,当我们每一步得到的fi(x)都是最小的时候,它们相加的F(x)也应该是最小,即最优解,问题变成了我们应该如何求解fi(x)呢?
贪心法在每次选择最优基函数f时,仍然比较困难,这时,我们想到了梯度下降的方法进行近似计算,我们将样本带入到基函数f得到f(x1),f(x2),f(x3),...,f(xn),从而L退化为向量L(y1,f(x1)),L(y2,f(x2)),L(y3,f(x3)),....,L(yn,f(xn)):
上面的式子中,权值
算法的步骤如下:
初始时,给定模型为常数:
对于m=1-M时:
计算伪残差:
使用数据
计算步长:
更新模型:
在上述的梯度提升的算法中,典型的模型就是梯度提升决策树GBDT。
3.梯度提升决策树GBDT
梯度提升的典型基函数即决策树(尤其是CART)
在第m步的梯度提升是根据伪残差数据计算决策树tm(x)。决策树根据叶子节点的数目,对输入空间进行划分成不相交的区域,并且在每个区域中,给出某个类型的确定性预测,因此我们可以使用指示函数I(x),对于输入的x,tm(x)可以表示为:
其中,bjm是样本在Rjm节点上的预测值,Rjm表示第m颗树的j叶子节点。
使用线性搜索计算学习率,最小化损失函数:
进一步的,对树的每个区域分别计算步长,从而系数bjm被合并到步长中:
对于上述的模型,我们也可以采取一些防止过拟合的措施,比如正则化。
4.XGBoost算法
根据Taylor展开式有:
分别计算一阶导和二阶导:
得到:
对于决策树的描述
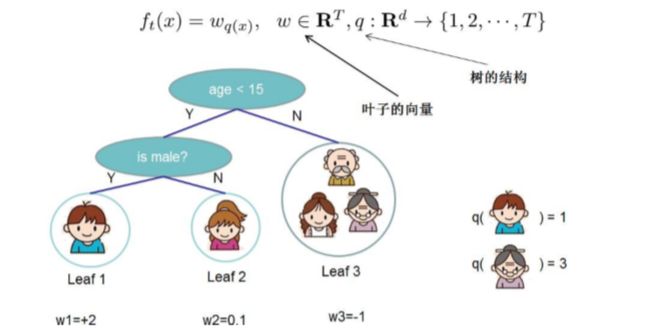
决策树是从根节点到叶结点的细化过程,落在相同的样本的预测值是相同的。假定决策树的叶结点数目为T,每个叶结点的权值构成向量W=(w1,w2,.....,wn),决策树则是构造如何使用特征得到划分,从而得到这些权值的过程。
样本X落在叶结点q中,定义f为:ft(x)=wq(x),举例如下:
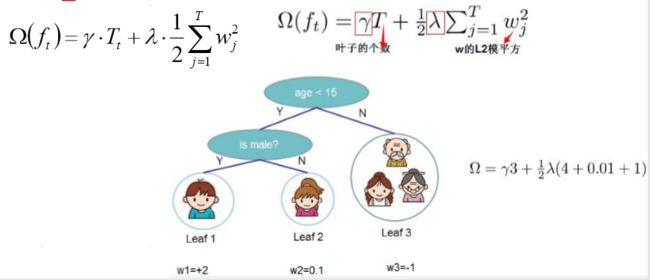
对于正则项的定义,我们可以考虑叶结点的数目和叶权值,如使用叶结点总数和也权值平方和的加权,则也不是唯一的定义方式:
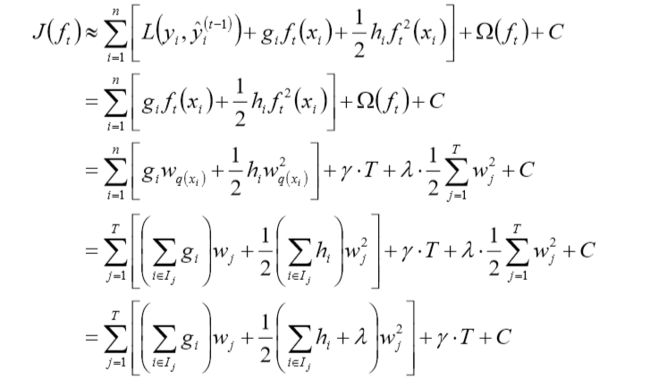
由此,我们就能够计算目标函数了:
目标函数的简化
上述的过程就是XGBoost的主要推导过程,相比于GDBT,XGBoost使用的是二阶的梯度信息,因而可以更快的在训练集上收敛。
5.Python中的XGBoost
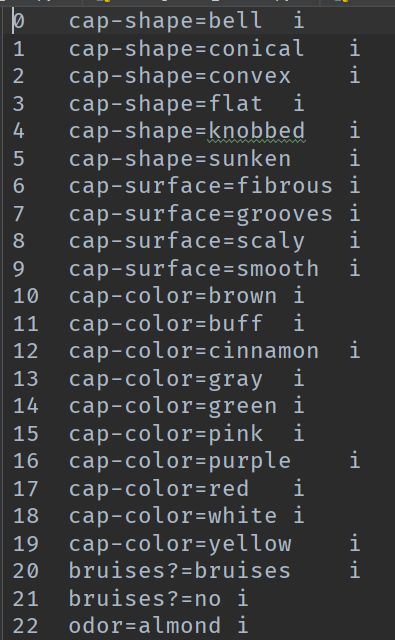
在XGBoost中数据的加载是使用其特有的数据格式进行训练的,我们可以使用XGBoost中的xgb.DMatrix(x_train, label=y_train)函数进行数据的加载,xgb.DMatrix()也支持libsvm格式的数据,这是一种稀疏数据的存储方式,xgb.DMatrix()可以直接读取这种数据格式:
libsvm数据格式是一种稀疏矩阵的表示方法,其中第1列为结果集,后面的每列含义为:该样本的特征序号:该样本对应的特征序号的值,对于特征数量多,且稀疏的时候非常的合适。
1 importxgboost as xgb2 importnumpy as np3
4 #读取libsvm数据
5 data_train = xgb.DMatrix('12.agaricus_train.txt')6 data_test = xgb.DMatrix('12.agaricus_test.txt')7
8
9 #读取普通的数据
10 data_train = xgb.DMatrix(x_train, label=y_train)11 data_test = xgb.DMatrix(x_test, label=y_test)
使用xgb.train()对模型进行训练,我们 XGBoost 之前, 我们必须设置三种类型的参数: (常规参数)general parameters,(提升器参数)booster parameters和(任务参数)task parameters。
参数的含义如下:
1 params ={2 'booster':'gbtree',3 'min_child_weight': 100,4 'eta': 0.1,5 'colsample_bytree': 0.7,6 'max_depth': 12,7 'subsample': 0.7,8 'alpha': 1,9 'gamma': 1,10 'silent': 0,11 'objective': 'reg:linear',12 'verbose_eval': True,13 'seed': 1
14 }
General Parameters
booster [default=gbtree]
有两中模型可以选择gbtree和gblinear。gbtree使用基于树的模型进行提升计算,gblinear使用线性模型进行提升计算。缺省值为gbtree。
silent [default=0]
取0时表示打印出运行时信息,取1时表示以缄默方式运行,不打印运行时信息。缺省值为0。
nthread [default to maximum number of threads available if not set]
XGBoost运行时的线程数。缺省值是当前系统可以获得的最大线程数
num_pbuffer [set automatically by xgboost, no need to be set by user]
size of prediction buffer, normally set to number of training instances. The buffers are used to save the prediction results of last boosting step.
num_feature [set automatically by xgboost, no need to be set by user]
boosting过程中用到的特征维数,设置为特征个数。XGBoost会自动设置,不需要手工设置。
Booster Parameters
eta [default=0.3]
为了防止过拟合,更新过程中用到的收缩步长。在每次提升计算之后,算法会直接获得新特征的权重。 eta通过缩减特征的权重使提升计算过程更加保守。缺省值为0.3
取值范围为:[0,1]
gamma [default=0]
minimum loss reduction required to make a further partition on a leaf node of the tree. the larger, the more conservative the algorithm will be.
range: [0,∞]
max_depth [default=6]
树的最大深度。缺省值为6
取值范围为:[1,∞]
min_child_weight [default=1]
孩子节点中最小的样本权重和。如果一个叶子节点的样本权重和小于min_child_weight则拆分过程结束。在现行回归模型中,这个参数是指建立每个模型所需要的最小样本数。
取值范围为: [0,∞]
max_delta_step [default=0]
Maximum delta step we allow each tree’s weight estimation to be. If the value is set to 0, it means there is no constraint. If it is set to a positive value, it can help making the update step more conservative. Usually this parameter is not needed, but it might help in logistic regression when class is extremely imbalanced. Set it to value of 1-10 might help control the update
取值范围为:[0,∞]
subsample [default=1]
用于训练模型的子样本占整个样本集合的比例。如果设置为0.5则意味着XGBoost将随机的冲整个样本集合中随机的抽取出50%的子样本建立树模型,这能够防止过拟合。
取值范围为:(0,1]
colsample_bytree [default=1]
在建立树时对特征采样的比例。缺省值为1
取值范围:(0,1]
Task Parameters
objective [ default=reg:linear ]
定义学习任务及相应的学习目标,可选的目标函数如下:
“reg:linear” –线性回归。
“reg:logistic” –逻辑回归。
“binary:logistic”–二分类的逻辑回归问题,输出为概率。
“binary:logitraw”–二分类的逻辑回归问题,输出的结果为wTx。
“count:poisson”–计数问题的poisson回归,输出结果为poisson分布。在poisson回归中,max_delta_step的缺省值为0.7。(used to safeguard optimization)
“multi:softmax” –让XGBoost采用softmax目标函数处理多分类问题,同时需要设置参数num_class(类别个数)
“multi:softprob” –和softmax一样,但是输出的是ndata * nclass的向量,可以将该向量reshape成ndata行nclass列的矩阵。没行数据表示样本所属于每个类别的概率。
“rank:pairwise”–set XGBoost to do ranking task by minimizing the pairwise loss
base_score [ default=0.5 ]
the initial prediction score of all instances, global bias
eval_metric [ default according to objective ]
校验数据所需要的评价指标,不同的目标函数将会有缺省的评价指标(rmse for regression, and error for classification, mean average precision for ranking)
用户可以添加多种评价指标,对于Python用户要以list传递参数对给程序,而不是map参数list参数不会覆盖’eval_metric’
The choices are listed below:
“rmse”: root mean square error
“logloss”: negative log-likelihood
“error”: Binary classification error rate. It is calculated as #(wrong cases)/#(all cases). For the predictions, the evaluation will regard the instances with prediction value larger than 0.5 as positive instances, and the others as negative instances.
“merror”: Multiclass classification error rate. It is calculated as #(wrong cases)/#(all cases).
“mlogloss”: Multiclass logloss
“auc”: Area under the curve for ranking evaluation.
“ndcg”:Normalized Discounted Cumulative Gain
“map”:Mean average precision
“ndcg@n”,”map@n”: n can be assigned as an integer to cut off the top positions in the lists for evaluation.
“ndcg-”,”map-”,”ndcg@n-”,”map@n-”: In XGBoost, NDCG and MAP will evaluate the score of a list without any positive samples as 1. By adding “-” in the evaluation metric XGBoost will evaluate these score as 0 to be consistent under some conditions. training repeatively
“gamma-deviance”: [residual deviance for gamma regression]
seed[ default=0 ]
random number seed.
随机数的种子。缺省值为0
dtrain:训练的数据
num_boost_round:这是指提升迭代的次数,也就是生成多少基模型
evals:这是一个列表,用于对训练过程中进行评估列表中的元素。形式是evals = [(dtrain,'train'),(dval,'val')]或者是evals = [(dtrain,'train')],对于第一种情况,它使得我们可以在训练过程中观察验证集的效果
obj:自定义目的函数
feval:自定义评估函数
maximize:是否对评估函数进行最大化
early_stopping_rounds:早期停止次数 ,假设为100,验证集的误差迭代到一定程度在100次内不能再继续降低,就停止迭代。这要求evals 里至少有 一个元素,如果有多个,按最后一个去执行。返回的是最后的迭代次数(不是最好的)。如果early_stopping_rounds存在,则模型会生成三个属性,bst.best_score,bst.best_iteration和bst.best_ntree_limit
evals_result:字典,存储在watchlist中的元素的评估结果。
verbose_eval :(可以输入布尔型或数值型),也要求evals里至少有 一个元素。如果为True,则对evals中元素的评估结果会输出在结果中;如果输入数字,假设为5,则每隔5个迭代输出一次。
learning_rates:每一次提升的学习率的列表,
xgb_model:在训练之前用于加载的xgb model。
看起来参数非常的多,但是我们在大部分的时候,只要指定一些调整的参数就行了。
1 data_train = xgb.DMatrix(x_train, label=y_train)2 data_test = xgb.DMatrix(x_test, label=y_test)3 watch_list = [(data_test, 'eval'), (data_train, 'train')]4 param = {'max_depth': 3, 'eta':0.5, 'silent': 0, 'objective': 'multi:softmax', 'num_class': 3}5
6 bst = xgb.train(param, data_train, num_boost_round=15, evals=watch_list)7 y_hat = bst.predict(data_test)
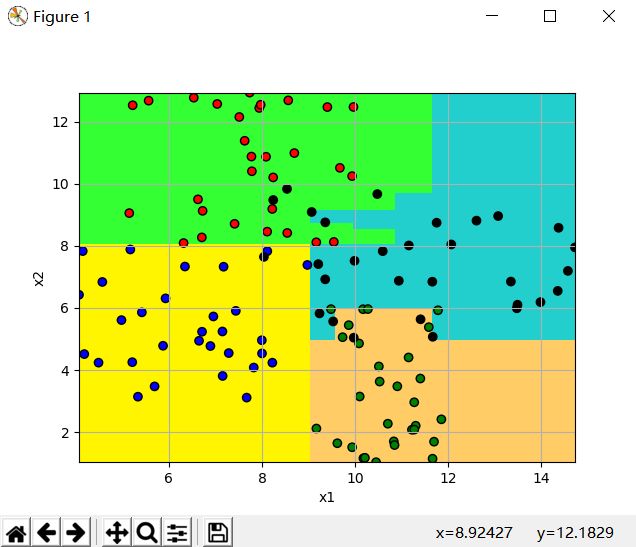
我们采用随机生成的数据使用XGBoost模型来进行测试:
1 importnumpy as np2 importsklearn as sk3 from sklearn.model_selection importtrain_test_split4 importxgboost as xgb5 importmatplotlib.pyplot as plt6 importmatplotlib as mpl7
8
9 defmarkData():10
11 x1 = 5 + np.random.rand(30)*5
12 y1 = 8 + np.random.rand(30)*5
13
14 x2 = 9 + np.random.rand(30) * 3
15 y2 = 1 + np.random.rand(30) * 5
16
17 x3 = 4 + np.random.rand(30) * 5
18 y3 = 3 + np.random.rand(30) * 5
19
20 x4 = 8 + np.random.rand(30) * 7
21 y4 = 5 + np.random.rand(30) * 5
22 #plt.figure()
23 #plt.plot(x1, y1, 'ro', linewidth=0.8, label='x1')
24 #plt.plot(x2, y2, 'ko', linewidth=0.8, label='x2')
25 #plt.plot(x3, y3, 'bo', linewidth=0.8, label='x3')
26 #plt.plot(x4, y4, 'go', linewidth=0.8, label='x4')
27 #plt.legend(loc="upper right",)
28 #plt.show()
29 #print(x1)
30 x =np.hstack((x1, x2, x3, x4))31 y =np.hstack((y1, y2, y3, y4))32 x = np.stack((x, y), axis=0).transpose()33 #print(x)
34 #plt.figure()
35 #plt.plot(x[0:30, 0], x[0:30, 1], 'ro', linewidth=0.8)
36 #plt.plot(x[30:60, 0], x[30:60, 1], 'bo', linewidth=0.8)
37 #plt.plot(x[60:90, 0], x[60:90, 1], 'go', linewidth=0.8)
38 #plt.plot(x[90:120, 0], x[90:120, 1], 'ko', linewidth=0.8)
39 #plt.show()
40 y = np.zeros(120)41 y[0:30] =042 y[30:60] = 1
43 y[60:90] = 2
44 y[90:120] =3
45 #print(y)
46 returnx, y47
48
49 if __name__ == '__main__':50 x, y =markData()51 x_train, x_test, y_train, y_test = train_test_split(x, y, train_size=0.75, random_state=1)52 #print(x_train)
53 #print(y_train)
54 data_train = xgb.DMatrix(x_train, label=y_train)55 data_test = xgb.DMatrix(x_test, label=y_test)56 #print(data_train)
57 #print(data_test)
58
59 #定义xgb的模型参数
60 parms = {'max_depth': 3, 'eta': 0.5, 'slient': 0, 'objective': 'multi:softmax', 'num_class': 4}61 watchlist = [(data_train, 'eval'), (data_test, 'train')]62 bst = xgb.train(parms, data_train, num_boost_round=6, evals=watchlist)63 y_hat =bst.predict(data_test)64
65 #计算准确率
66 print(np.mean(y_hat ==y_test))67
68 #绘制分类图片
69 N, M = 200, 200
70 x_min, x_max =np.min(x[:, 0]), np.max(x[:, 0])71 y_min, y_max = np.min(x[:, 1]), np.max(x[:, 1])72 x1 =np.linspace(x_min, x_max, N)73 x2 =np.linspace(y_min, y_max, M)74 tx, ty =np.meshgrid(x1, x2)75 xx = np.stack((tx.flat, ty.flat), axis=1)76 data_xx =xgb.DMatrix(xx)77 yy =bst.predict(data_xx)78 yy =yy.reshape(tx.shape)79
80 cmp_light = mpl.colors.ListedColormap(['#33FF33', '#FFCC66', '#FFF500', '#22CFCC'])81 cmp_drak = mpl.colors.ListedColormap(['r', 'g', 'b', 'k'])82
83 plt.figure()84 plt.pcolormesh(tx, ty, yy, cmap=cmp_light)85 plt.scatter(x[:, 0], x[:, 1], c=y, edgecolors='k', cmap=cmp_drak)86 plt.xlabel("x1")87 plt.ylabel("x2")88 plt.xlim(x_min, x_max)89 plt.ylim(y_min, y_max)90 plt.grid(True)91 plt.show()
运行结果如下:


