鸢尾花数据集及PCA降维
鸢尾花数据集输出每个样本的特征属性值
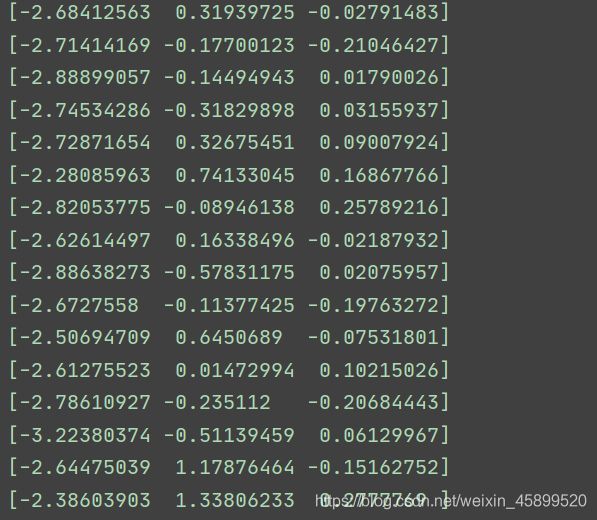
PCA处理输出降维之后的特征属性值
import numpy as np
import pandas as pd
import matplotlib.pyplot as plt
from mpl_toolkits.mplot3d import Axes3D
from sklearn import decomposition
from sklearn import datasets
np.random.seed(5)
centers = [[1, 1], [-1, -1], [1, -1]]
iris = datasets.load_iris()  #鸢尾花数据对象
X = iris.data  #数据
y = iris.target  #特征
###展示属性值
data=iris
tt = pd.DataFrame(data=data.data, columns=data.feature_names) #将数据集数据转换成panda
tt['species'] = data.target  #把鸢尾花类型加入到数据集中
data = tt
data.rename(columns={'sepal length (cm)':"萼片长",
                     "sepal width (cm)":"萼片宽",
                     "petal length (cm)":"花瓣长",
                     "petal width (cm)":"花瓣宽",
                     "species":"种类"},inplace=True)
kind_dict = {
    0:"Setosa",
    1:"Versicolour",
    2:"Virginica"
}
data["种类"] = data["种类"].map(kind_dict)
data.head() #数据集的内容如下
print(data.head(150))
#######画出三维图
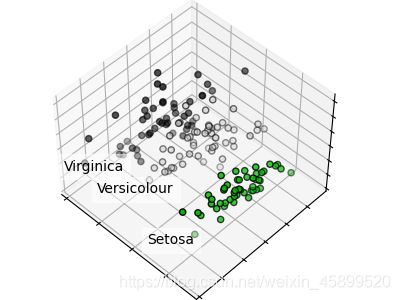
fig = plt.figure(1, figsize=(4, 3))
plt.clf()  #只会清除数字 仍然可以在其上绘制另一个绘图
ax = Axes3D(fig, rect=[0, 0, .95, 1], elev=48, azim=134)
plt.cla()  #当前活动轴在当前图中。 它保持其他轴不变
pca = decomposition.PCA(n_components=3)   #这里为维数
pca.fit(X)
X = pca.transform(X)
####显示方差
# print(pca.explained_variance_ratio_)  #投影后的三个维度的方差分布 [0.92461872 0.05306648 0.01710261]
# print(pca.explained_variance_) #方差 [4.22824171 0.24267075 0.0782095 ]

for name, label in [('Setosa', 0), ('Versicolour', 1), ('Virginica', 2)]:
    ax.text3D(X[y == label, 0].mean(),
              X[y == label, 1].mean() + 1.5,
              X[y == label, 2].mean(), name,
              horizontalalignment='center',
              bbox=dict(alpha=.5, edgecolor='w', facecolor='w'))
# Reorder the labels to have colors matching the cluster results
y = np.choose(y, [1, 2, 0]).astype(np.float)
ax.scatter(X[:, 0], X[:, 1], X[:, 2], c=y, cmap=plt.cm.nipy_spectral,edgecolor='k')
#ax.scatter(X[:, 0], X[:, 1], c=y, cmap=plt.cm.nipy_spectral,edgecolor='k')
for i in range(len(X[:,0])):
    print(X[i])
ax.w_xaxis.set_ticklabels([])
ax.w_yaxis.set_ticklabels([])
ax.w_zaxis.set_ticklabels([])
plt.show()


