数据分析——“红酒口感”数据集
文章目录
-
-
- 0.数据集介绍
- 1.红酒口感数据集的读取与分析
- 2.变量关系可视化(平行坐标图)
- 3.属性对相关性可视化
-
0.数据集介绍
红酒口感数据集包括将近 1 599 种红酒的数据。每一种红酒都有一系列化学成分的测量指标,包括酒精含量、挥发性酸、亚硝酸盐。每种红酒都有一个口感评分值,是三个专业评酒员的评分的平均值。
1.红酒口感数据集的读取与分析
import pandas as pd
from pandas import DataFrame
from pylab import *
import matplotlib.pyplot as plot

target_url = ("http://archive.ics.uci.edu/ml/machine-learning-databases/wine-quality/winequality-red.csv")

## 数据集读取
wine = pd.read_csv(target_url,header=0, sep=";")
print(wine.head())

## 数据集统计
summary = wine.describe()
print(summary)

## 归一化
wineNormalized = wine
ncols = len(wineNormalized.columns)

for i in range(ncols):
    mean = summary.iloc[1,i]
    sd = summary.iloc[2,i]
    wineNormalized.iloc[:,i:(i + 1)] = (wineNormalized.iloc[:,i:(i + 1)] - mean) / sd

array = wineNormalized.values

## 绘制箱线图
boxplot(array)
plot.xlabel("Attribute Index")
plot.ylabel(("Quartile Ranges - Normalized "))
show()
   fixed acidity  volatile acidity  citric acid  residual sugar  chlorides  \
0            7.4              0.70         0.00             1.9      0.076
1            7.8              0.88         0.00             2.6      0.098
2            7.8              0.76         0.04             2.3      0.092
3           11.2              0.28         0.56             1.9      0.075
4            7.4              0.70         0.00             1.9      0.076

   free sulfur dioxide  total sulfur dioxide  density    pH  sulphates  \
0                 11.0                  34.0   0.9978  3.51       0.56
1                 25.0                  67.0   0.9968  3.20       0.68
2                 15.0                  54.0   0.9970  3.26       0.65
3                 17.0                  60.0   0.9980  3.16       0.58
4                 11.0                  34.0   0.9978  3.51       0.56

   alcohol  quality
0      9.4        5
1      9.8        5
2      9.8        5
3      9.8        6
4      9.4        5
       fixed acidity  volatile acidity  citric acid  residual sugar  \
count    1599.000000       1599.000000  1599.000000     1599.000000
mean        8.319637          0.527821     0.270976        2.538806
std         1.741096          0.179060     0.194801        1.409928
min         4.600000          0.120000     0.000000        0.900000
25%         7.100000          0.390000     0.090000        1.900000
50%         7.900000          0.520000     0.260000        2.200000
75%         9.200000          0.640000     0.420000        2.600000
max        15.900000          1.580000     1.000000       15.500000

         chlorides  free sulfur dioxide  total sulfur dioxide      density  \
count  1599.000000          1599.000000           1599.000000  1599.000000
mean      0.087467            15.874922             46.467792     0.996747
std       0.047065            10.460157             32.895324     0.001887
min       0.012000             1.000000              6.000000     0.990070
25%       0.070000             7.000000             22.000000     0.995600
50%       0.079000            14.000000             38.000000     0.996750
75%       0.090000            21.000000             62.000000     0.997835
max       0.611000            72.000000            289.000000     1.003690

                pH    sulphates      alcohol      quality
count  1599.000000  1599.000000  1599.000000  1599.000000
mean      3.311113     0.658149    10.422983     5.636023
std       0.154386     0.169507     1.065668     0.807569
min       2.740000     0.330000     8.400000     3.000000
25%       3.210000     0.550000     9.500000     5.000000
50%       3.310000     0.620000    10.200000     6.000000
75%       3.400000     0.730000    11.100000     6.000000
max       4.010000     2.000000    14.900000     8.000000
从箱线图中可以直观发现数据集中的异常点。数值型统计信息和箱线图都显示含有大量的边缘点。在对此数据集进行训练时要记住这一点。当分析预测模型的性能时,这些边缘点很可能就是分析模型预测错误的一个重要来源。
2.变量关系可视化(平行坐标图)
import pandas as pd
from pandas import DataFrame
from pylab import *
import matplotlib.pyplot as plot
from math import exp

target_url = ("http://archive.ics.uci.edu/ml/machine-learning-databases/wine-quality/winequality-red.csv")

## 数据集读取
wine = pd.read_csv(target_url,header=0, sep=";")
print(wine.head())

## 数据集统计
summary = wine.describe()
nrows = len(wine.index)
tasteCol = len(summary.columns)
meanTaste = summary.iloc[1,tasteCol - 1]
sdTaste = summary.iloc[2,tasteCol - 1]
nDataCol = len(wine.columns) -1

## 绘制平行坐标图
for i in range(nrows):
    #plot rows of data as if they were series data
    dataRow = wine.iloc[i,1:nDataCol]
    normTarget = (wine.iloc[i,nDataCol] - meanTaste)/sdTaste
    labelColor = 1.0/(1.0 + exp(-normTarget))
    dataRow.plot(color=plot.cm.RdYlBu(labelColor), alpha=0.5)

plot.xlabel("Attribute Index")
plot.ylabel(("Attribute Values"))
plot.show()

## 归一化
wineNormalized = wine
ncols = len(wineNormalized.columns)
for i in range(ncols):
    mean = summary.iloc[1, i]
    sd = summary.iloc[2, i]
    wineNormalized.iloc[:,i:(i + 1)] =(wineNormalized.iloc[:,i:(i + 1)] - mean) / sd

## 归一化后重新绘制平行坐标图
for i in range(nrows):
    #plot rows of data as if they were series data
    dataRow = wineNormalized.iloc[i,1:nDataCol]
    normTarget = wineNormalized.iloc[i,nDataCol]
    labelColor = 1.0/(1.0 + exp(-normTarget))
    dataRow.plot(color=plot.cm.RdYlBu(labelColor), alpha=0.5)

plot.xlabel("Attribute Index")
plot.ylabel(("Attribute Values"))
plot.show()
   fixed acidity  volatile acidity  citric acid  residual sugar  chlorides  \
0            7.4              0.70         0.00             1.9      0.076
1            7.8              0.88         0.00             2.6      0.098
2            7.8              0.76         0.04             2.3      0.092
3           11.2              0.28         0.56             1.9      0.075
4            7.4              0.70         0.00             1.9      0.076

   free sulfur dioxide  total sulfur dioxide  density    pH  sulphates  \
0                 11.0                  34.0   0.9978  3.51       0.56
1                 25.0                  67.0   0.9968  3.20       0.68
2                 15.0                  54.0   0.9970  3.26       0.65
3                 17.0                  60.0   0.9980  3.16       0.58
4                 11.0                  34.0   0.9978  3.51       0.56

   alcohol  quality
0      9.4        5
1      9.8        5
2      9.8        5
3      9.8        6
4      9.4        5
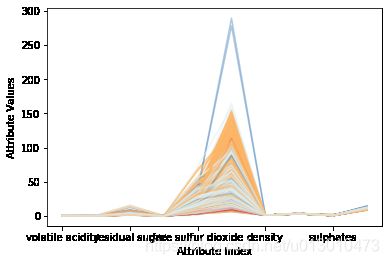
加入颜色标记的平行坐标图更易于观察属性与目标的相关程度。图1的平行坐标图主要不足在于对取值范围较小的变量进行了压缩。为了克服这个问题,先对红酒数据进行了归一化,然后重绘平行坐标图。图2为归一化之后的平行坐标图。归一化红酒数据的平行坐标图可以更方便地观察出目标与哪些属性相关。图2展示了属性间清晰的相关性。在图的最右边,深蓝线(高口感评分值)聚集在酒精含量属性的高值区域;但是图的最左边,深红线(低口感评分值)聚集在挥发性酸属性的高值区域。这些都是最明显的相关属性。
3.属性对相关性可视化
import pandas as pd
from pandas import DataFrame
from pylab import *
import matplotlib.pyplot as plot

target_url = ("http://archive.ics.uci.edu/ml/machine-learning-databases/wine-quality/winequality-red.csv")

## 数据集读取
wine = pd.read_csv(target_url,header=0, sep=";")

## 计算所有实值列(包括目标)的相关矩阵
corMat = DataFrame(wine.iloc[:,:].corr())
print(corMat)

## 使用热图可视化相关矩阵
plot.pcolor(corMat)
plot.show()
                      fixed acidity  volatile acidity  citric acid  \
fixed acidity              1.000000         -0.256131     0.671703
volatile acidity          -0.256131          1.000000    -0.552496
citric acid                0.671703         -0.552496     1.000000
residual sugar             0.114777          0.001918     0.143577
chlorides                  0.093705          0.061298     0.203823
free sulfur dioxide       -0.153794         -0.010504    -0.060978
total sulfur dioxide      -0.113181          0.076470     0.035533
density                    0.668047          0.022026     0.364947
pH                        -0.682978          0.234937    -0.541904
sulphates                  0.183006         -0.260987     0.312770
alcohol                   -0.061668         -0.202288     0.109903
quality                    0.124052         -0.390558     0.226373

                      residual sugar  chlorides  free sulfur dioxide  \
fixed acidity               0.114777   0.093705            -0.153794
volatile acidity            0.001918   0.061298            -0.010504
citric acid                 0.143577   0.203823            -0.060978
residual sugar              1.000000   0.055610             0.187049
chlorides                   0.055610   1.000000             0.005562
free sulfur dioxide         0.187049   0.005562             1.000000
total sulfur dioxide        0.203028   0.047400             0.667666
density                     0.355283   0.200632            -0.021946
pH                         -0.085652  -0.265026             0.070377
sulphates                   0.005527   0.371260             0.051658
alcohol                     0.042075  -0.221141            -0.069408
quality                     0.013732  -0.128907            -0.050656

                      total sulfur dioxide   density        pH  sulphates  \
fixed acidity                    -0.113181  0.668047 -0.682978   0.183006
volatile acidity                  0.076470  0.022026  0.234937  -0.260987
citric acid                       0.035533  0.364947 -0.541904   0.312770
residual sugar                    0.203028  0.355283 -0.085652   0.005527
chlorides                         0.047400  0.200632 -0.265026   0.371260
free sulfur dioxide               0.667666 -0.021946  0.070377   0.051658
total sulfur dioxide              1.000000  0.071269 -0.066495   0.042947
density                           0.071269  1.000000 -0.341699   0.148506
pH                               -0.066495 -0.341699  1.000000  -0.196648
sulphates                         0.042947  0.148506 -0.196648   1.000000
alcohol                          -0.205654 -0.496180  0.205633   0.093595
quality                          -0.185100 -0.174919 -0.057731   0.251397

                       alcohol   quality
fixed acidity        -0.061668  0.124052
volatile acidity     -0.202288 -0.390558
citric acid           0.109903  0.226373
residual sugar        0.042075  0.013732
chlorides            -0.221141 -0.128907
free sulfur dioxide  -0.069408 -0.050656
total sulfur dioxide -0.205654 -0.185100
density              -0.496180 -0.174919
pH                    0.205633 -0.057731
sulphates             0.093595  0.251397
alcohol               1.000000  0.476166
quality               0.476166  1.000000

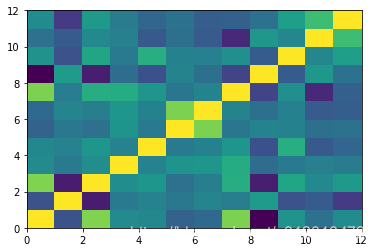
上图为属性之间、属性与目标之间的关联热图。在这个热图中,黄色对应强相关(颜色标尺的选择与平行坐标图中的正好相反)。红酒数据的关联热图显示口感评分值(最后一列)与酒精含量(倒数第二列)高度正相关,但是与其他几个属性(包括挥发性酸(第二列)等)高度负相关。平行坐标图和关联热图都说明酒精含量高则口感评分值高,然而挥发性酸高则口感评分值低。在预测模型中的一部分工作就是研究各种属性对预测的重要性。红酒数据集就是一个很好的例子,展示了如何通过探究数据来知晓向从哪个方向努力来构建预测模型以及如何评价预测模型。


