效果:
代码:
import numpy as np
import matplotlib.pyplot as plt
import matplotlib
# 指定默认字体
matplotlib.rcParams['font.sans-serif'] = ['FangSong']
matplotlib.rcParams['font.family'] = 'sans-serif'
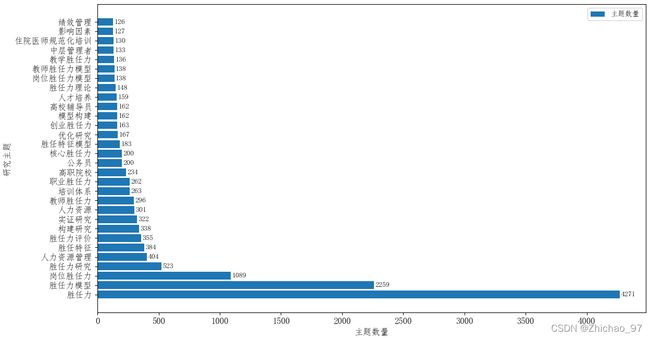
x = np.array(['胜任力', '胜任力模型', '岗位胜任力', '胜任力研究', '人力资源管理', '胜任特征', '胜任力评价', '构建研究','实证研究','人力资源','教师胜任力',
'培训体系','职业胜任力','高职院校','公务员','核心胜任力','胜任特征模型','优化研究','创业胜任力','模型构建','高校辅导员','人才培养','胜任力理论',
'岗位胜任力模型','教师胜任力模型','教学胜任力','中层管理者','住院医师规范化培训','影响因素','绩效管理'])
y = np.array([4271, 2259, 1089, 523, 404, 384, 355, 338,322,301,296,263,262,234,200,200,183,167,163,162,162,159,148,138,138,136,133,130,127,126])
# 调整柱子粗细
plt.barh(x, y, height = 0.8, label='主题数量')
# 给条形图添加数据标注
for index, y_value in enumerate(y):
plt.text(y_value+10, index-0.2, "%s" %y_value)
# 调整坐标轴
plt.ylabel('研究主题', fontdict={'size':12})
plt.xlabel('主题数量', fontdict={'size':12})
plt.yticks(size=12)
plt.xticks(size=12)
plt.legend(loc='best')
plt.show()