第六周PCL学习(六)
目录
一、点云特征描述与提取
1.1 概述
1.2 法线估计
1.3 点云特征描述
1.4 实验部分
1.4.1 法线估计
1.4.2 实验部分
1.4.3实验部分
1.4.4 实验部分
一、点云特征描述与提取
1.1 概述
3D点云特征描述与提取是点云信息处理中最基础也是最关键的一部分,点云的识别、分割,重采样,配准曲面重建等处理大部分算法,都严重依赖特征描述与提取的结果。从尺度上来分,一般分为局部特征的描述和全局特征的描述,例如局部的法线等几何形状特征的描述,全局的拓朴特征的描述,都属于3D点云特征描述与提取的范畴。
1.2 法线评估
(1)估计一个点云的表面法线
表面法线是几何体表面一个十分重要的属性
例如:在进行光照渲染时产生符合可视习惯的效果时需要表面法线的信息才能正常进行,对于一个已经已经知道的几何体表面,根据垂直于点表面的的矢量,因此推断处表面某一点的法线方向比较容易,然而由于我们获取的点云的数据集在真实的物体的表面表现为一组定点的样本,这样就会有两种方法解决:
1 . 使用曲面重建技术,从获取的点云数据中得到采样点对应的曲面,然后从曲面模型中计算出表面法线
2. 直接从点云数据中近似推断表面法线
在确定表面一点法线的问题近似于估计表面的一个相切面法线的问题,因此转换过来就是求一个最小二乘法平面拟合的问题
(2)使用积分图法估计法线
此方法只适用于有序点云的处理。
有序点云和无序点云的简单介绍
积分图讲解与应用
1.3 点云特征描述
(1)PFH(point feature histogram)点特征直方描述子每一点对,原有12个参数,6个坐标值,6个坐标姿态(基于法线)
PHF计算没一点对的 相对坐标角度差值三个值和 坐标点之间的欧氏距离 d从12个参数减少到4个参数
默认PFH的实现使用5个区间分类(例如:四个特征值中的每个都使用5个区间来统计),其中不包括距离(在上文中已经解释过了——但是如果有需要的话,也可以通过用户调用computePairFeatures方法来获得距离值),这样就组成了一个125浮点数元素的特征向量(15),
其保存在一个pcl::PFHSignature125的点类型中。
PFH的详细讲解
(2)FPFH
快速点特征直方图FPFH(Fast Point Feature Histograms)把算法的计算复杂度降低到了O(nk) ,但是任然保留了PFH大部分的识别特性。
查询点和周围k个点的连线 的4参数特征,也就是1×k=k个线
默认的FPFH实现使用11个统计子区间(例如:四个特征值中的每个都将它的参数区间分割为11个),
特征直方图被分别计算然后合并得出了浮点值的一个33元素的特征向量,
这些保存在一个pcl::FPFHSignature33点类型中。
FPFH的详细讲解,以及与PFH的比较, VFH的讲解
(3)VFH
它是一种新的特征表示形式,应用在点云聚类识别和六自由度位姿估计问题。
视点特征直方图(或VFH)是源于FPFH描述子.
由于它的获取速度和识别力,我们决定利用FPFH强大的识别力,但是为了使构造的特征保持缩放不变性的性质同时,还要区分不同的位姿,计算时需要考虑加入视点变量。
我们做了以下两种计算来构造特征,以应用于目标识别问题和位姿估计:
1.扩展FPFH,使其利用整个点云对象来进行计算估计(如2图所示),在计算FPFH时以物体中心点与物体表面其他所有点之间的点对作为计算单元。
2.添加视点方向与每个点估计法线之间额外的统计信息,为了达到这个目的,我们的关键想法是在FPFH计算中将视点方向变量直接融入到相对法线角计算当中。
因此新组合的特征被称为视点特征直方图(VFH)。
下图表体现的就是新特征的想法,包含了以下两部分:
1.一个视点方向相关的分量
2.一个包含扩展FPFH的描述表面形状的分量
对扩展的FPFH分量来说,默认的VFH的实现使用45个子区间进行统计,
而对于视点分量要使用128个子区间进行统计,这样VFH就由一共308个浮点数组成阵列。308 = 45 * 4 + 128
在PCL中利用pcl::VFHSignature308的点类型来存储表示。PFH/FPFH描述子和VFH之间的主要区别是:
对于一个已知的点云数据集,只一个单一的VFH描述子,
而合成的PFH/FPFH特征的数目和点云中的点数目相同。
(4)ROPS特征(Rotational Projection Statistics) 描述子
0.在关键点出建立局部坐标系。
1.在一个给定的角度在当前坐标系下对关键点领域(局部表面) 进行旋转
2.把 局部表面 投影到 xy,yz,xz三个2维平面上
3.在每个投影平面上划分不同的盒子容器,把点分到不同的盒子里
4.根据落入每个盒子的数量,来计算每个投影面上的一系列数据分布
(熵值,低阶中心矩)
5.M11,M12,M21,M22,E。E是信息熵。4*2+1=9)进行描述
计算值将会组成子特征。
盒子数量 × 旋转次数×9 得到特征维度
我们把上面这些步骤进行多次迭代。不同坐标轴的子特征将组成RoPS描述器
我们首先要找到目标模型:
points 包含点云
indices ROPS特征的点的标号,也就是关键点的标号
triangles 三角面元
Rops实验
(5)基于惯性矩与偏心率的描述子
momentofinertiaestimation类获取基于惯性偏心矩 描述子。
这个类还允许提取云的有向包围盒OBB和坐标轴对齐包围盒AABB。
但请记住,所提取有向OBB包围盒并不一定是最小的包围盒。
理论基础
(a)首先计算点云的协方差矩阵,提取其特征值和向量,并且构造局部坐标系,以点云重心为坐标系原点,得到的特征向量已被归一化,并且以主特征向量作为X轴,最小特征值对应的特征向量作为Z轴,剩下的特征向量作为Y轴,符合右手坐标系。
(b)在下一个步骤中,迭代过程发生。每次迭代时旋转主特征向量(X轴)。旋转顺序总是相同的,并且在其他特征向量周围执行,这提供了点云旋转的不变性。
(c)此后,我们将把这个旋转主向量作为当前轴。然后在当前轴上计算转动惯量 和 将点云投影到以旋转向量为法线的平面上计算偏心
1.4 实验部分
(1)法线估计
(a)法线估计类NormalEstimation
一旦确定邻域以后,查询点的邻域点可以用来估计一个局部特征描述子,它用查询点周围领域点描述采样面的几何特征,描述几何表面图形的一个重要属性,
首先是推断它在坐标系中的方位,也就是估计他的法线,表面法线是表面的一个重要的属性,在许多领域都有重要的应用,如果用光源来生成符合视觉效果
的渲染等。
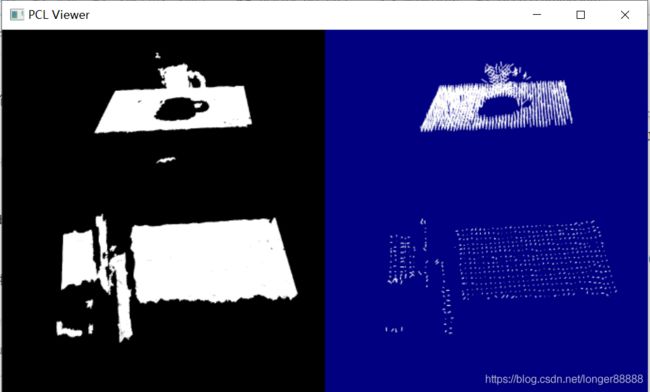
(实现对输入点云数据集中的点估计一组表面法线)
执行的操作:
对于点云Point中的每个点p:
1、得到p的最近邻点。
2、计算p点的表面法线n。
3、检查n的方向是否一致指向视点,如果不是则翻转。
#include
VTK_MODULE_INIT(vtkRenderingOpenGL);
VTK_MODULE_INIT(vtkInteractionStyle);

#include
#include
#include   //法线估计类头文件
#include
#include
#include

int
main()
{
	//打开点云代码
	pcl::PointCloud::Ptr cloud(new pcl::PointCloud);
	pcl::io::loadPCDFile("table_scene_lms400.pcd", *cloud);
	//创建法线估计估计向量
	pcl::NormalEstimation ne;
	ne.setInputCloud(cloud);
	//创建一个空的KdTree对象,并把它传递给法线估计向量
	//基于给出的输入数据集,KdTree将被建立
	pcl::search::KdTree::Ptr tree(new pcl::search::KdTree());
	ne.setSearchMethod(tree);
	//存储输出数据
	pcl::PointCloud::Ptr cloud_normals(new pcl::PointCloud);
	//使用半径在查询点周围3厘米范围内的所有临近元素
	ne.setRadiusSearch(0.03);
	//计算特征值
	ne.compute(*cloud_normals);
	// cloud_normals->points.size ()应该与input cloud_downsampled->points.size ()有相同的尺寸
	//可视化
	pcl::visualization::PCLVisualizer viewer("PCL Viewer");
	viewer.setBackgroundColor(0.0, 0.0, 0.0);
	viewer.addPointCloudNormals(cloud, cloud_normals);

	while (!viewer.wasStopped())
	{
		viewer.spinOnce();
	}

	return 0;
}
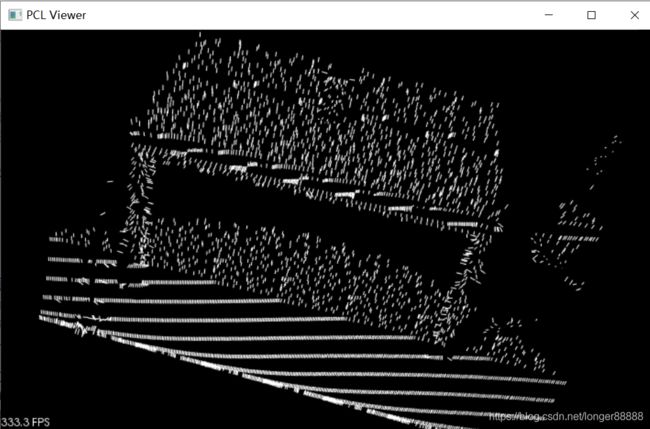
运行结果:可以发现其视点方向是一致的。这个运行速度很慢,运行时不能着急。
(b)使用积分图估计法线
切记:此方法只适合与有序点云,对于无序点云是不适用的。
其中有下面一些预测方法
enum NormalEstimationMethod
{
  COVARIANCE_MATRIX,
  AVERAGE_3D_GRADIENT,
  AVERAGE_DEPTH_CHANGE
};
COVARIANCE_MATRIX模型,从最近邻的协方差矩阵创建了9个积分图去计算一个点的法线。
AVERAGE_3D_GRADIENT模型创建了6个积分图去计算3D梯度里面竖直和水平方向的光滑部分,同时利用两个梯度的卷积来计算法线。
AVERAGE_DEPTH_CHANGE模型创造了一个单一的积分图,从平均深度的变化中来计算法线。
#include
#include
#include
#include
int
main()
{
	//加载点云
	pcl::PointCloud::Ptr cloud(new pcl::PointCloud);
	pcl::io::loadPCDFile("table_scene_mug_stereo_textured.pcd", *cloud);
	//估计法线
	pcl::PointCloud::Ptr normals(new pcl::PointCloud);
	pcl::IntegralImageNormalEstimation ne;
	ne.setNormalEstimationMethod(ne.AVERAGE_3D_GRADIENT);  // 设置估计方法(预测方案)
	ne.setMaxDepthChangeFactor(0.02f);  // 最大深度变化系数
	ne.setNormalSmoothingSize(10.0f);  // 优化法线方向时考虑邻域大小
	ne.setInputCloud(cloud);  // 输入点云,必须是有序点云
	ne.compute(*normals);  // 执行法线估计,存储结果到normal中
	//法线可视化
	pcl::visualization::PCLVisualizer viewer("PCL Viewer");
	int viewpoint1(0);
	viewer.createViewPort(0, 0, 0.5, 1, viewpoint1);
	viewer.setBackgroundColor(0, 0, 0, viewpoint1);
	viewer.addPointCloud(cloud, "cloud1", viewpoint1);

	int viewpoint2(1);
	viewer.createViewPort(0.5, 0, 1, 1, viewpoint2);
	viewer.setBackgroundColor(0.0, 0.0, 0.5,viewpoint2);
	viewer.addPointCloudNormals(cloud,normals,100,0.02,"normals2",viewpoint2);  // 添加点云
	// 第一个参数是点云数据,第二个参数是法线,第三个参数是法线水平程度(默认100,代表垂直),第四个参数是缩放比例(法线的长度)
	//第五个参数是id,第六个参数代表显示的视图id
	while (!viewer.wasStopped())
	{
		viewer.spinOnce();
	}
	return 0;
}
(2) PFH、FPFH、VFH
代码如下,这个代码先读取点云数据--->再进行过滤---->法线评估----->求取PFH、FPFH、VFH特征。
还对其进行了可视化。
#include
#include
#include
#include
#include
#include
#include
#include
#include
#include
#include
#include
#include
#include


using namespace std;

int
main() {
	// 加载点云
	pcl::PointCloud::Ptr cloud(new pcl::PointCloud);
	// pcl::PointCloud::Ptr normals(new pcl::PointCloud);
	pcl::io::loadPCDFile("table_scene_mug_stereo_textured.pcd", *cloud);

	// 打印点云信息
	cout << "cloud::  width: " << cloud->width << "  height: " << cloud->height << "  size: "<< cloud->points.size() << endl;

	// ------过滤数据-------//
	pcl::PointCloud::Ptr cloud_fillter(new pcl::PointCloud);
	// 过滤passthrough
	pcl::PassThrough filter;
	filter.setInputCloud(cloud);
	filter.setFilterFieldName("z");
	filter.setFilterLimits(0.0f, 1.0f);
	filter.filter(*cloud_fillter);

	// 再进行三角栅格过滤
	pcl::PointCloud::Ptr cloud_filter2(new pcl::PointCloud);
	pcl::VoxelGrid voxel;
	voxel.setInputCloud(cloud_fillter);
	voxel.setLeafSize(0.01, 0.01, 0.01);
	voxel.filter(*cloud_filter2);

	// 估计法线
	pcl::NormalEstimation ne;
	ne.setInputCloud(cloud_filter2);
	// 定义查询树
	pcl::search::KdTree::Ptr kdtree(new pcl::search::KdTree());
	ne.setSearchMethod(kdtree);
	ne.setRadiusSearch(0.03);
	//存储输出数据
	pcl::PointCloud::Ptr normals(new pcl::PointCloud);
	//使用半径在查询点周围3厘米范围内的所有临近元素
	ne.setRadiusSearch(0.03);
	//计算特征值
	ne.compute(*normals);

	cout << "normal::  width:" << normals->width << "  height: " << normals->height << "  size: " << normals->points.size() << endl;

	//pcl::IntegralImageNormalEstimation normal_estimation;
	//normal_estimation.setNormalEstimationMethod(normal_estimation.AVERAGE_3D_GRADIENT);
	//normal_estimation.setMaxDepthChangeFactor(0.02F);
	//normal_estimation.setNormalSmoothingSize(10.0f);
	//normal_estimation.setInputCloud(cloud);
	//normal_estimation.compute(*normals);  // 计算法线

	// 设置搜索方法

	//pcl::KdTreeFLANN::Ptr tree(new pcl::KdTreeFLANN);


	// -----------PFH特征实例化--------- //
	pcl::PFHEstimation pfhe;
	pfhe.setInputCloud(cloud_filter2);  // 传入点云
	pfhe.setInputNormals(normals);  // 传入法线
	pcl::search::KdTree::Ptr search_method(new pcl::search::KdTree());
	pfhe.setSearchMethod(search_method);  // 设置近邻搜索方法
	//使用半径在5厘米范围内的所有邻元素。
    //注意:此处使用的半径必须要大于估计表面法线时使用的半径!!!
	pfhe.setRadiusSearch(0.05);  // 设置查询半径

	// 设置输出集
	pcl::PointCloud::Ptr pfhs(new pcl::PointCloud);
	// 计算pfh的特征集
	pfhe.compute(*pfhs);

	cout << "PFH:: width: " << pfhs->width << "  height: " << pfhs->height << "  size: " << pfhs->points.size() << endl;

	 //pfh可视化
	/*pcl::visualization::PCLHistogramVisualizer view;
	view.setBackgroundColor(0, 0, 0);
	view.addFeatureHistogram(*output, "output", 10);
	view.spinOnce();*/

	// ---------------FPFH实例化------------------//
	pcl::FPFHEstimation fpfh;
	fpfh.setInputCloud(cloud_filter2);
	fpfh.setInputNormals(normals);
	fpfh.setSearchMethod(search_method);
	fpfh.setRadiusSearch(0.05);

	// 设置输出集
	pcl::PointCloud::Ptr fpfhs(new pcl::PointCloud);
	fpfh.compute(*fpfhs);
	cout << "FPFH::  width:" << fpfhs->width << "  height: " << fpfhs->height << "  size: " << fpfhs->points.size() << endl;
	// -----------------VFH实例化-------------------//
	pcl::VFHEstimation vfh;
	vfh.setInputCloud(cloud_filter2);
	vfh.setInputNormals(normals);
	vfh.setSearchMethod(search_method);
	vfh.setRadiusSearch(0.05);

	// 设置VFH输出集
	pcl::PointCloud::Ptr vfhs(new pcl::PointCloud);
	vfh.compute(*vfhs);
	cout << "VFH::  width: "<width<<"  height: "<height<<"  size: "  << vfhs->points.size() << endl;

	// -------------- 点云数据可视化------------- //
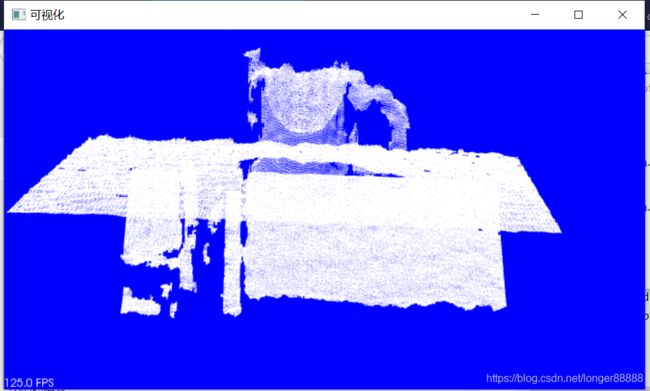
	pcl::visualization::PCLVisualizer viewer("可视化");
	viewer.setBackgroundColor(0, 0, 1);
	viewer.addPointCloud(cloud, "cloud");
	// viewer.setPointCloudRenderingProperties(pcl::visualization::PCL_VISUALIZER_POINT_SIZE, 4, "cloud");
	pcl::visualization::PointCloudColorHandlerCustom(cloud, 0, 1, 0);
	viewer.spinOnce();

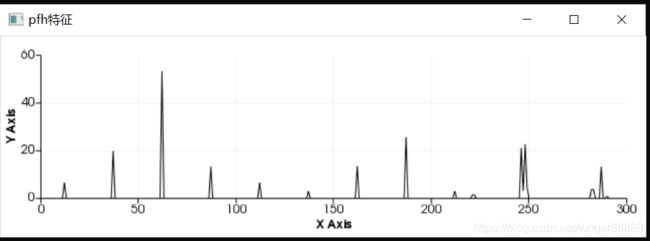
	 pcl::visualization::PCLPlotter plotter("pfh特征");
	 plotter.setWindowName("pfh特征");
	 plotter.addFeatureHistogram(*pfhs, 300); //设置的很坐标长度,该值越大,则显示的越细致
	 plotter.plot();

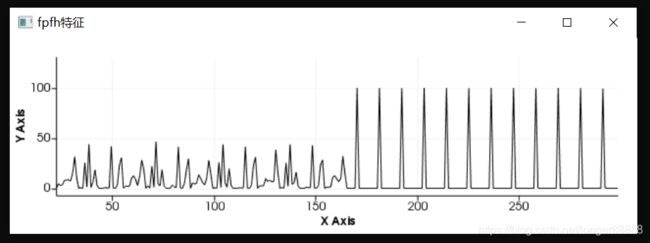
	 pcl::visualization::PCLPlotter fpfh_plotter("fpfh特征");
	 fpfh_plotter.setWindowName("fpfh特征");
	 fpfh_plotter.addFeatureHistogram(*fpfhs, 300); //设置的很坐标长度,该值越大,则显示的越细致
	 fpfh_plotter.plot();

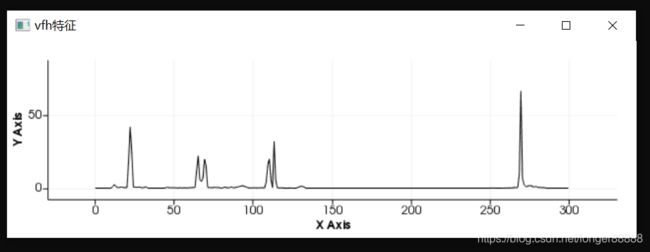
	 pcl::visualization::PCLPlotter vfh_plotter("vfh特征");
	 vfh_plotter.setWindowName("vfh特征");
	 vfh_plotter.addFeatureHistogram(*vfhs, 300); //设置的很坐标长度,该值越大,则显示的越细致
	 vfh_plotter.plot();

	 return 0;
}
运行结果如下,这是点云、法线、pfh、fpfh、vfh计算得到的数据大小
 这是点云数据的可视化
(3)ROPS
#include
#include
#include
#include
int main (int argc, char** argv)
{
	if (argc != 4)
		return (-1);

	// 定义点云指针
	pcl::PointCloud::Ptr cloud (new pcl::PointCloud ());
	if (pcl::io::loadPCDFile (argv[1], *cloud) == -1)
		return (-1);

	// 定义共享索引
	pcl::PointIndicesPtr indices = boost::shared_ptr  (new pcl::PointIndices ());
	// 定义索引文件
	std::ifstream indices_file;
	indices_file.open (argv[2], std::ifstream::in);  // 打开文件
	// 读取索引文件内容
	for (std::string line; std::getline (indices_file, line);)
	{
		std::istringstream in (line);
		unsigned int index = 0;
		in >> index;
		indices->indices.push_back (index - 1);
	}
	indices_file.close ();
	// 定义多边形
	std::vector  triangles;
	// 多边形文件
	std::ifstream triangles_file;
	triangles_file.open (argv[3], std::ifstream::in);
	// 读取多边形文件
	for (std::string line; std::getline (triangles_file, line);)
	{
		pcl::Vertices triangle;
		std::istringstream in (line);
		unsigned int vertex = 0;
		in >> vertex;
		triangle.vertices.push_back (vertex - 1);
		in >> vertex;
		triangle.vertices.push_back (vertex - 1);
		in >> vertex;
		triangle.vertices.push_back (vertex - 1);
		triangles.push_back (triangle);
	}

	float support_radius = 0.0285f;  // 查询半径
	unsigned int number_of_partition_bins = 5;  // 直方图的宽
	unsigned int number_of_rotations = 3;  // 旋转角度

	pcl::search::KdTree::Ptr search_method (new pcl::search::KdTree);
	search_method->setInputCloud (cloud);

	// 定义ROPS对象
	pcl::ROPSEstimation  > feature_estimator;
	feature_estimator.setSearchMethod (search_method);  // 设置查询方案
	feature_estimator.setSearchSurface (cloud);
	feature_estimator.setInputCloud (cloud);
	feature_estimator.setIndices (indices);
	feature_estimator.setTriangles (triangles);
	feature_estimator.setRadiusSearch (support_radius);
	feature_estimator.setNumberOfPartitionBins (number_of_partition_bins);
	feature_estimator.setNumberOfRotations (number_of_rotations);
	feature_estimator.setSupportRadius (support_radius);

	// 定义直方图
	pcl::PointCloud >::Ptr histograms (new pcl::PointCloud  > ());
	feature_estimator.compute (*histograms);

	std::cout<header<setWindowName(title);//所以用该函数设置窗口名。
	plotter->setShowLegend (true);
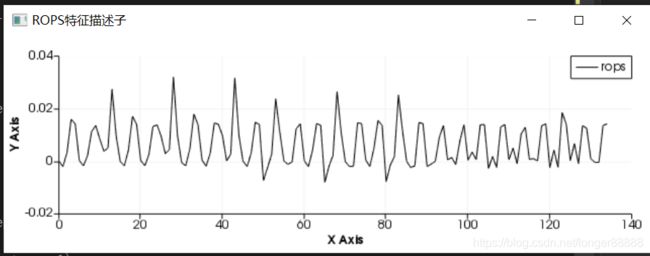
	plotter->addFeatureHistogram>(*histograms,135,"rops");//
	//显示第0个索引对应点的特征直方图,如果要显示其他索引,本来对于PCL中用POINT_CLOUD_REGISTER_POINT_STRUCT注册的结构体,例如fpfh等特征,就可以利用函数
    /*pcl::visualization::PCLPlotter::addFeatureHistogram (
    const pcl::PointCloud &cloud,
    const std::string &field_name,
    const int index,
    const std::string &id, int win_width, int win_height),但本例中的pcl::Histogram <135>是没用POINT_CLOUD_REGISTER_POINT_STRUCT注册过,即没有field_name,简单的显示方式就是把想显示
	的点对应的特征向量,作为单独一个新的点云来对待,就可以显示*/
	plotter->spin();
	return (0);
}
(4)MomentOfInertia
#include
#include
#include
#include
#include
#include

int main (int argc, char** argv)
{
  if (argc != 2)
    return (0);

  pcl::PointCloud::Ptr cloud (new pcl::PointCloud ());
  if (pcl::io::loadPCDFile (argv[1], *cloud) == -1)
    return (-1);

  // 实例化
  pcl::MomentOfInertiaEstimation  feature_extractor;
  feature_extractor.setInputCloud (cloud);  // 输入点云
  feature_extractor.compute (); // 开始特征计算

  std::vector  moment_of_inertia;  // 存储惯性矩的特征向量
  std::vector  eccentricity;  // 存储偏心率的特征向量

  pcl::PointXYZ min_point_AABB;  // 坐标轴对齐包围盒
  pcl::PointXYZ max_point_AABB;
  pcl::PointXYZ min_point_OBB;  // 有向包围盒
  pcl::PointXYZ max_point_OBB;
  pcl::PointXYZ position_OBB;  // 定义的位置
  Eigen::Matrix3f rotational_matrix_OBB;  // 有向包围盒旋转角度
  float major_value, middle_value, minor_value;
  Eigen::Vector3f major_vector, middle_vector, minor_vector;
  Eigen::Vector3f mass_center;

  feature_extractor.getMomentOfInertia (moment_of_inertia);  // 计算惯性矩特征
  feature_extractor.getEccentricity (eccentricity);  // 计算偏心率特征
  feature_extractor.getAABB (min_point_AABB, max_point_AABB);  // AABB对应左下角和右下角的坐标
  feature_extractor.getOBB (min_point_OBB, max_point_OBB, position_OBB, rotational_matrix_OBB);
  // OBB对应的左上角、右下角、位置、旋转角度
  feature_extractor.getEigenValues (major_value, middle_value, minor_value);  // 三个特征值
  feature_extractor.getEigenVectors (major_vector, middle_vector, minor_vector);  // 三个特征向量
  feature_extractor.getMassCenter (mass_center);  // 点云中心坐标

  // 定义可视化
  boost::shared_ptr viewer (new pcl::visualization::PCLVisualizer ("基于惯性矩与偏心率的描述子"));
  viewer->setBackgroundColor (1, 1, 1);
  viewer->addCoordinateSystem (1.0);
  viewer->initCameraParameters ();
  // 添加点云
  viewer->addPointCloud (cloud,pcl::visualization::PointCloudColorHandlerCustom(cloud,0,255,0), "sample cloud");
  viewer->setPointCloudRenderingProperties(pcl::visualization::PCL_VISUALIZER_POINT_SIZE,5,"sample cloud");
  // AABB的可视化(使用Cube)
  viewer->addCube (min_point_AABB.x, max_point_AABB.x, min_point_AABB.y, max_point_AABB.y, min_point_AABB.z, max_point_AABB.z, 1.0, 0.0, 0.0, "AABB");
   viewer->setShapeRenderingProperties(pcl::visualization::PCL_VISUALIZER_OPACITY,0.1,"AABB");
    viewer->setShapeRenderingProperties(pcl::visualization::PCL_VISUALIZER_LINE_WIDTH,4,"AABB");
  // OBB的位置
  Eigen::Vector3f position (position_OBB.x, position_OBB.y, position_OBB.z);
  std::cout<<"position_OBB: "<addCube (position, quat, max_point_OBB.x - min_point_OBB.x, max_point_OBB.y - min_point_OBB.y, max_point_OBB.z - min_point_OBB.z, "OBB");
  viewer->setShapeRenderingProperties(pcl::visualization::PCL_VISUALIZER_COLOR,0,0,1,"OBB");
  viewer->setShapeRenderingProperties(pcl::visualization::PCL_VISUALIZER_OPACITY,0.1,"OBB");
  viewer->setShapeRenderingProperties(pcl::visualization::PCL_VISUALIZER_LINE_WIDTH,4,"OBB");
  viewer->setRepresentationToWireframeForAllActors();
  // 绘制中心坐标
  pcl::PointXYZ center (mass_center (0), mass_center (1), mass_center (2));
  pcl::PointXYZ x_axis (major_vector (0) + mass_center (0), major_vector (1) + mass_center (1), major_vector (2) + mass_center (2));
  pcl::PointXYZ y_axis (middle_vector (0) + mass_center (0), middle_vector (1) + mass_center (1), middle_vector (2) + mass_center (2));
  pcl::PointXYZ z_axis (minor_vector (0) + mass_center (0), minor_vector (1) + mass_center (1), minor_vector (2) + mass_center (2));
  viewer->addLine (center, x_axis, 1.0f, 0.0f, 0.0f, "major eigen vector");
  viewer->addLine (center, y_axis, 0.0f, 1.0f, 0.0f, "middle eigen vector");
  viewer->addLine (center, z_axis, 0.0f, 0.0f, 1.0f, "minor eigen vector");
  std::cout<<"size of cloud :"<points.size()<wasStopped())
  {
    viewer->spinOnce (100);
    boost::this_thread::sleep (boost::posix_time::microseconds (100000));
  }

  return (0);
}
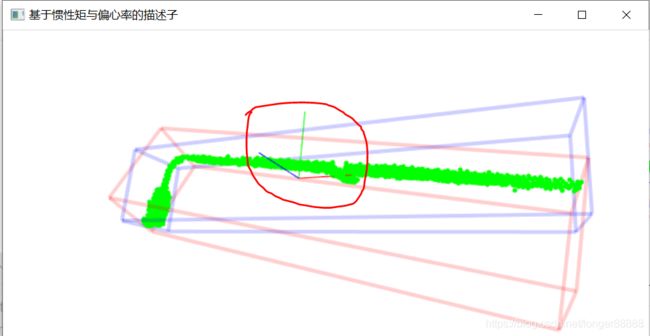
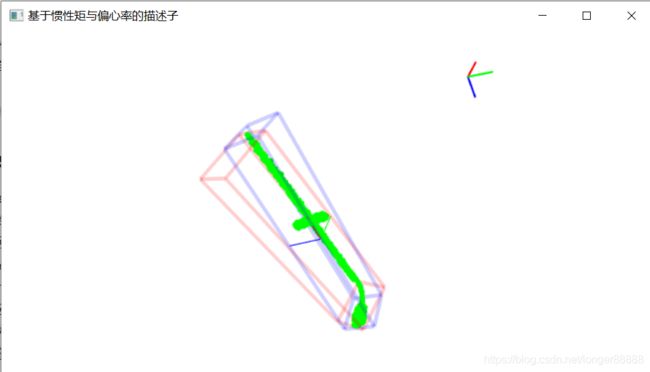
运行结果,蓝色的为OBB(有向包围盒),红色的为AABB(坐标轴对齐包围盒),绿色的为点云可视化,红色圆圈是中心点和特征向量。
二、总结
     本周学习了点云特征与提取的内容,了解了pfh、fpfh、vfh等知识点,代码来源与PCL官网和《点云库PCL从入门到精通》,还有部分来自于参考文献中。
     通过此次学习,明白了滤波器的重要性,当初运行pfh的代码时,没有进行滤波处理,结果运行速度超级慢,将近花费了一个多小时,都没能出来结果,
最后看了一个博客,然后把点云数据先通过passthrough,再通过VoxelGrid栅格进行过滤。通过这个步骤很快就运行出来了。
三、参考文献
不适定问题(这篇博客主要讲述了什么是不适定问题)
PCL 点云特征描述与提取(这篇博客讲解了特征提取的一些基本概念流程和代码)
点云特征提取
法线点云估计(这篇博客讲述了点云估计的知识,和《点云库PCL从入门到精通》的内容是一致的)
法线评估(有实验代码)
pcl点云特征提取 法线估计 PFH FPFH NARF 惯量偏心矩 RoPs特征 视点特征直方图VFH GASD特征(这篇博客讲述了各个点云特征的原理和实现代码)
