1.填充两条曲线之间区域
import matplotlib.pyplot as plt
import numpy as np


n = 1000
x = np.linspace(0, 8*np.pi, n)
sin_x = np.sin(x)
cos_x = np.cos(x/2)/2

plt.figure('filling graph')
plt.xlabel('x')
plt.ylabel('y')
plt.grid(linestyle=':')
plt.plot(x, sin_x, label='$y=sin(x)$')
plt.plot(x, cos_x, label='$y=cos(x)$')
plt.fill_between(x, sin_x, cos_x, sin_x < cos_x, color='orangered', alpha=0.5)
plt.fill_between(x, sin_x, cos_x, sin_x > cos_x, color='blue', alpha=0.5)
plt.legend()
# plt.tight_layout()
plt.show()

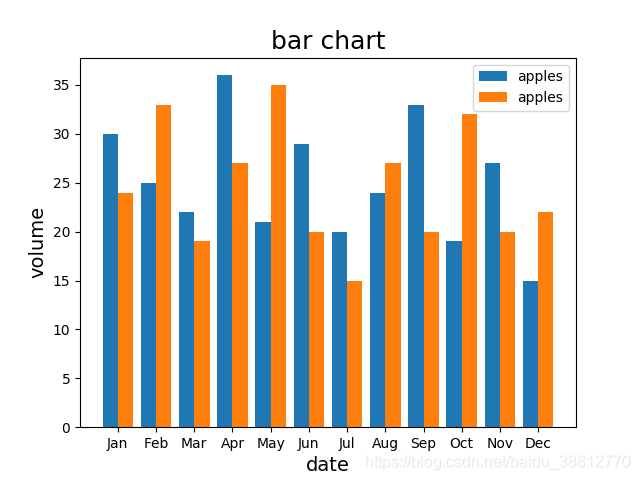
2.柱状图
import matplotlib.pyplot as plt
import numpy as np

# 柱状图
plt.figure('bar chart')
plt.title('bar chart', fontsize=18)
apples = np.array([30, 25, 22, 36, 21, 29, 20, 24, 33, 19, 27, 15])
oranges = np.array([24, 33, 19, 27, 35, 20, 15, 27, 20, 32, 20, 22])
plt.xlabel('date', fontsize=14)
plt.ylabel('volume', fontsize=14)
x = np.arange(apples.size)
plt.bar(
    x-0.2, apples, 0.4, label='apples'
)
plt.bar(
    x+0.2, oranges, 0.4, label='apples'
)
plt.xticks(x, ['Jan', 'Feb', 'Mar', 'Apr', 'May', 'Jun',
           'Jul', 'Aug', 'Sep', 'Oct', 'Nov', 'Dec'])
plt.legend()
plt.show()
3.饼状图
# 饼状图
plt.figure('pie chart')
plt.title('pie chart', fontsize=20)
values = [26, 17, 21, 29, 11]
spaces = [0.01]*5
labels = ['python', 'c', 'c++', 'java', 'php']
colors = ['red', 'blue', 'green', 'grey', 'orange']
# plt.axis('equal')
plt.pie(
    values,
    spaces,
    labels,
    colors,
    '%d%%',
    # shadow=True,
    radius=1
)
plt.show()

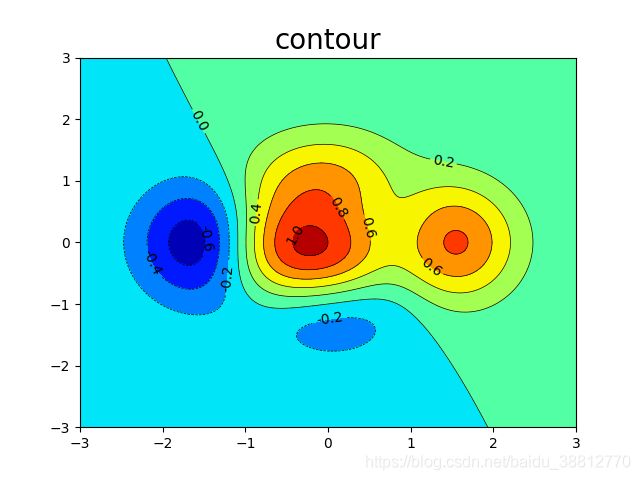
4.等高线
# 等高线

n = 1000
x, y = np.meshgrid(np.linspace(-3, 3, n), np.linspace(-3, 3, n))
z = (1 - x/2 + x**5 + y**3) * np.exp(-x**2 - y**2)

plt.figure('contour', facecolor='grey')
plt.title('contour', fontsize=20)

# 绘制等高线
plt.contourf(x,
             y,
             z,
             8,                # 等高线份数
             cmap='jet')
con = plt.contour(x, y, z, 8, colors='black', linewidths=0.5)     # 线设置
# 增加标签
plt.clabel(con, inline_spacing=1, fmt='%0.1f', fontsize=10)
plt.show()
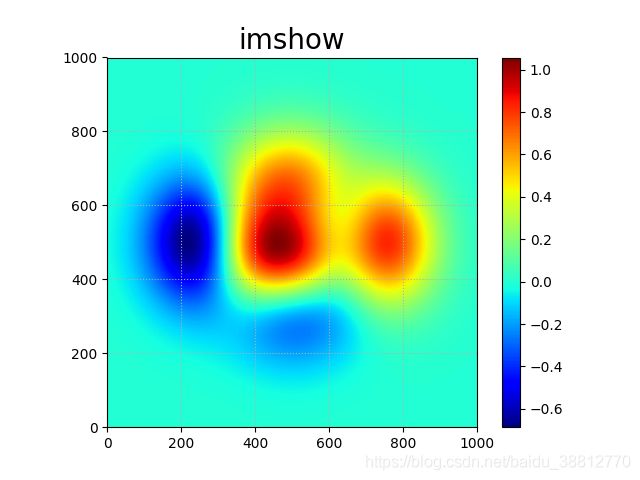
5.热成像图
# 热成像
n = 1000
x, y = np.meshgrid(np.linspace(-3, 3, n), np.linspace(-3, 3, n))
z = (1 - x/2 + x**5 + y**3) * np.exp(-x**2 - y**2)
plt.figure('imshow', facecolor='grey')
plt.title('imshow', fontsize=20)
plt.grid(linestyle=':')

plt.imshow(z, cmap='jet', origin='low')
plt.colorbar()                 # 显示颜色样式条
plt.show()

6.极坐标绘制星型图
x = np.linspace(0, 6*np.pi, 1000)

plt.polar(x, 1 + np.cos(3*x) + 1.5*np.sin(3*x)**2)
plt.show()
7.3D图形绘制
from mpl_toolkits.mplot3d import axes3d


# 三维点阵
n = 1000
x = np.random.normal(0, 1, n)
y = np.random.normal(0, 1, n)
z = np.random.normal(0, 1, n)
d = np.sqrt(x**2+y**2+z**2)

plt.figure('3d scatter', facecolor='grey',)
ax = plt.gca(projection='3d')
plt.title('3d scatter', fontsize=20)
ax.set_xlabel('x')
ax.set_ylabel('y')
ax.set_zlabel('z')
ax.scatter(x, y, z, s=60, c=d, cmap='jet')
plt.show()


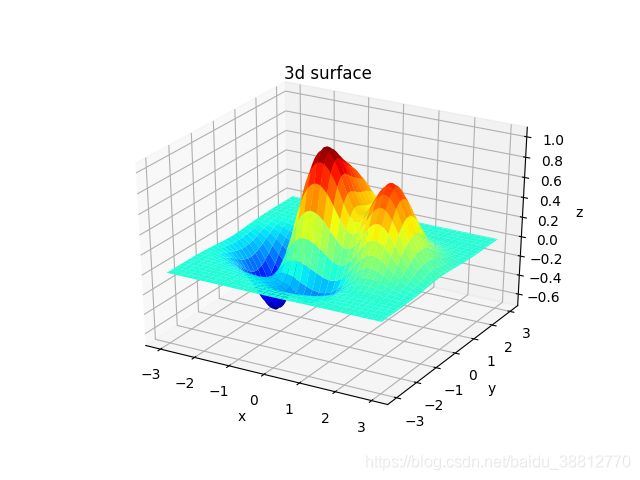
# 3d平面图
n = 1000
x, y = np.meshgrid(np.linspace(-3, 3, n), np.linspace(-3, 3, n))
z = (1 - x/2 + x**5 + y**3) * np.exp(-x**2 - y**2)
plt.figure('3d surface')
ax = plt.gca(projection='3d')
ax.set_xlabel('x')
ax.set_ylabel('y')
ax.set_zlabel('z')

ax.plot_surface(x, y, z, rstride=30, cstride=30, cmap='jet')
plt.show()

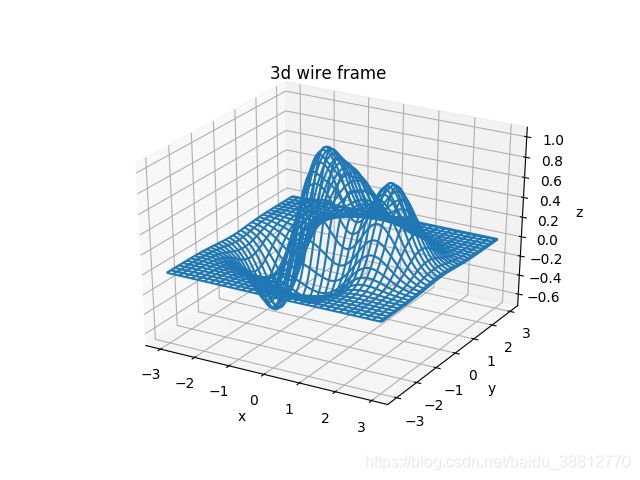
# 三维线框图
n = 1000
x, y = np.meshgrid(np.linspace(-3, 3, n), np.linspace(-3, 3, n))
z = (1 - x/2 + x**5 + y**3) * np.exp(-x**2 - y**2)
plt.figure('3d wire frame')
ax = plt.gca(projection='3d')
plt.title('3d wire frame')
ax.set_xlabel('x')
ax.set_ylabel('y')
ax.set_zlabel('z')

ax.plot_wireframe(x, y, z, rstride=30, cstride=30, cmap='jet')
plt.show()

8.简单动画绘制
# 简单动画
import matplotlib.animation as ma

# 自定义一种可以存放在ndarray里的类型,用于保存一个球
ball_type = np.dtype([
    ('position', float, 2),  # 位置(水平和垂直坐标)
    ('size', float, 1),      # 大小
    ('growth', float, 1),    # 生长速度
    ('color', float, 4)])    # 颜色(红、绿、蓝和透明度)
n = 100
balls = np.zeros(n, dtype=ball_type)
balls['position'] = np.random.uniform(0, 1, (n, 2))
balls['size'] = np.random.uniform(40, 70, n)
balls['growth'] = np.random.uniform(10, 20, n)
balls['color'] = np.random.uniform(0, 1, (n, 4))

plt.figure('animation')
plt.title('animation', fontsize=20)
plt.xticks([])
plt.yticks([])

sc = plt.scatter(
    balls['position'][:, 0],
    balls['position'][:, 1],
    balls['size'],
    color=balls['color'], alpha=0.5)


# 定义更新
def update(number):
    balls['size'] += balls['growth']
    ball_ind = number % n
    balls[ball_ind]['size'] = np.random.uniform(40, 70, 1)
    balls[ball_ind]['position'] = np.random.uniform(0, 1, (1, 2))
    sc.set_sizes(balls['size'])
    sc.set_offsets(balls['position'])


# 每隔30毫秒执行一次update更新函数,作用于mp.gcf()当前窗口对象
# plt.gcf():	获取当前窗口
# update:		更新函数
# interval:	间隔时间(单位:毫秒)
anim = ma.FuncAnimation(plt.gcf(), update, interval=3)

plt.show()

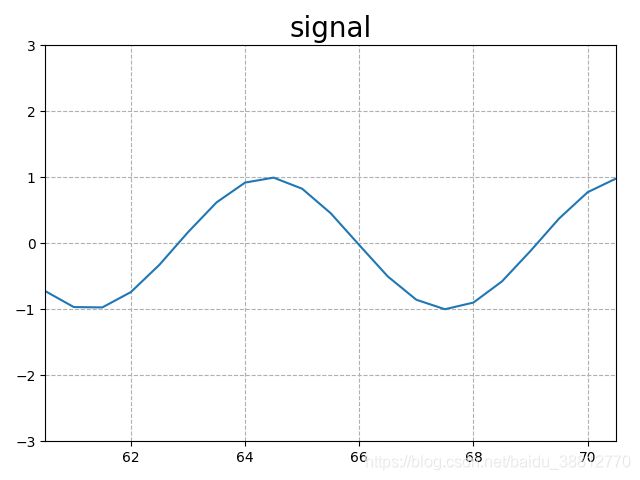
9.使用生成器绘制y=sin(x)
# 使用生成器绘制动画
plt.figure('signal')
plt.title('signal', fontsize=20)

plt.ylim(-3, 3)
plt.xlim(0, 10)

plt.grid(linestyle='--')
pl = plt.plot([], [], label='signal')[0]
pl.set_data([], [])

x = 0


def update(data):
    t, v = data
    x, y = pl.get_data()
    x.append(t)
    y.append(v)
    # 重新设置数据
    pl.set_data(x, y)
    # 移动坐标轴
    if x[-1] > 10:
        plt.xlim(x[-1]-10, x[-1])


def y_generator():
    global x
    # y = np.sin(2 * np.pi * x) * np.exp(np.sin(0.2 * np.pi * x))
    y = np.sin(x)
    yield (x, y)
    x += 0.5


anim = ma.FuncAnimation(plt.gcf(), update, y_generator, interval=30)
plt.tight_layout()
plt.show()
