antV的X6使用
醉卧沙场君莫笑,古来征战几人还。

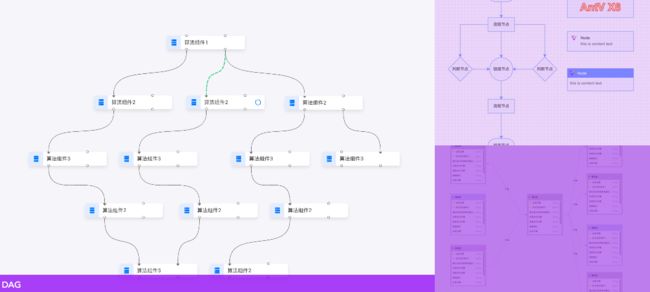
一、简介
数据驱动的图形编辑引擎,以流程图展示关系流程,支持拖拽
二、基础使用
所有图表示例
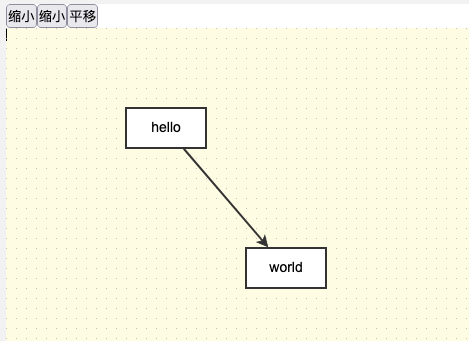
1. 实现一个最简易的Graph
⑴. 安装
# npm
$ npm install @antv/x6 --save

# yarn
$ yarn add @antv/x6
⑵. vue代码
react 的通道 ->
<template>
    <div id="container" />
template>
<script>
import { Graph } from "@antv/x6";
export default {
    name: "",
    data() {
        return {};
    },
    mounted() {
        this.initGraph();
    },
    methods: {
        initGraph() {
            // 1. 节点 nodes 和边 edges 字段 的 JSON 数据
            const data = {
                // 节点
                nodes: [
                    {
                        id: "node1", // String,可选,节点的唯一标识
                        x: 40, // Number,必选,节点位置的 x 值
                        y: 40, // Number,必选,节点位置的 y 值
                        width: 80, // Number,可选,节点大小的 width 值
                        height: 40, // Number,可选,节点大小的 height 值
                        label: "hello" // String,节点标签
                    },
                    {
                        id: "node2", // String,节点的唯一标识
                        x: 160, // Number,必选,节点位置的 x 值
                        y: 180, // Number,必选,节点位置的 y 值
                        width: 80, // Number,可选,节点大小的 width 值
                        height: 40, // Number,可选,节点大小的 height 值
                        label: "world" // String,节点标签
                    }
                ],
                // 边
                edges: [
                    {
                        source: "node1", // String,必须,起始节点 id
                        target: "node2" // String,必须,目标节点 id
                    }
                ]
            };

            // 2. 渲染画布
            const graph = new Graph({
                container: document.getElementById("container"),
                width: 800,
                height: 600
            });

            // 3. 渲染我们的节点和边
            graph.fromJSON(data);
        }
    }
};
script>
⑶. 效果展示

2. 背景和网格
可设置背景颜色和网格,另外还支持背景图片、网格类型等配置

const graph = new Graph({
  // ...
  background: {
    color: '#fffbe6', // 设置画布背景颜色
  },
  grid: {
    size: 10,      // 网格大小 10px
    visible: true, // 渲染网格背景
  },
});
3. 缩放和平移
能够缩放和平移画布
<template>
    <div>
        <button @click="enlarge">缩小button>
        <button @click="narrow">缩小button>
        <button @click="move">平移button>
        <div id="container" />
    div>
template>
<script>
import { Graph } from "@antv/x6";
export default {
    name: "",
    data() {
        return {
            graph: {}
        };
    },
    mounted() {
        this.initGraph();
    },
    methods: {
        initGraph() {
            // 1. 节点 nodes 和边 edges 字段 的 JSON 数据
            const data = {
                // 节点
                nodes: [
                    {
                        id: "node1", // String,可选,节点的唯一标识
                        x: 40, // Number,必选,节点位置的 x 值
                        y: 40, // Number,必选,节点位置的 y 值
                        width: 80, // Number,可选,节点大小的 width 值
                        height: 40, // Number,可选,节点大小的 height 值
                        label: "hello" // String,节点标签
                    },
                    {
                        id: "node2", // String,节点的唯一标识
                        x: 160, // Number,必选,节点位置的 x 值
                        y: 180, // Number,必选,节点位置的 y 值
                        width: 80, // Number,可选,节点大小的 width 值
                        height: 40, // Number,可选,节点大小的 height 值
                        label: "world" // String,节点标签
                    }
                ],
                // 边
                edges: [
                    {
                        source: "node1", // String,必须,起始节点 id
                        target: "node2" // String,必须,目标节点 id
                    }
                ]
            };

            // 2. 渲染画布
            this.graph = new Graph({
                container: document.getElementById("container"),
                width: 800,
                height: 600,
                background: {
                    color: "#fffbe6" // 设置画布背景颜色
                },
                grid: {
                    size: 10, // 网格大小 10px
                    visible: true // 渲染网格背景
                }
            });

            // 3. 渲染我们的节点和边
            this.graph.fromJSON(data);
        },
        enlarge() {
            this.graph.zoom(-0.5);
        },
        narrow() {
            this.graph.zoom(0.5);
        },
        move() {
            this.graph.translate(80, 40)
        }
    }
};
script>
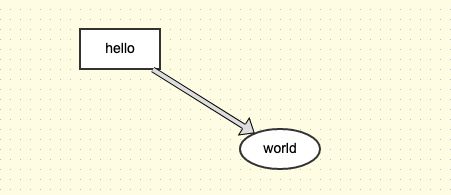
4. 节点
可以通过 shape 属性为节点指定渲染的图形

            // 1. 节点 nodes 和边 edges 字段 的 JSON 数据
            const data = {
                // 节点
                nodes: [
                    {
                        id: "node1",
                        shape: "rect", // 使用 rect 渲染
                        x: 100,
                        y: 200,
                        width: 80,
                        height: 40,
                        label: "hello"
                    },
                    {
                        id: "node2",
                        shape: "ellipse", // 使用 ellipse 渲染
                        x: 300,
                        y: 200,
                        width: 80,
                        height: 40,
                        label: "world"
                    }
                ],
                edges: [
                    {
                        source: "node1",
                        target: "node2"
                    }
                ]
            };
5. 定制节点样式
可以通过 attrs 对象来配置节点样式

            // 1. 节点 nodes 和边 edges 字段 的 JSON 数据
            const data = {
                // 节点
                nodes: [
                    {
                        id: "node1",
                        x: 40,
                        y: 40,
                        width: 100,
                        height: 40,
                        attrs: {
                            body: {
                                fill: "#2ECC71",
                                stroke: "#000",
                                strokeDasharray: "10,2"
                            },
                            label: {
                                text: "Hello",
                                fill: "#333",
                                fontSize: 13
                            }
                        }
                    },
                    {
                        id: "node2",
                        x: 180,
                        y: 240,
                        width: 100,
                        height: 40,
                        attrs: {
                            body: {
                                fill: "#F39C12",
                                stroke: "#000",
                                rx: 16,
                                ry: 16
                            },
                            label: {
                                text: "World",
                                fill: "#333",
                                fontSize: 18,
                                fontWeight: "bold",
                                fontVariant: "small-caps"
                            }
                        }
                    }
                ],
                edges: [
                    {
                        source: "node1",
                        target: "node2"
                    }
                ]
            };
6. 边
可以通过 shape 属性为边指定渲染的图形
            // 1. 节点 nodes 和边 edges 字段 的 JSON 数据
            const data = {
                // 节点
                nodes: [
                    {
                        id: "node1",
                        shape: "rect",
                        x: 100,
                        y: 100,
                        width: 80,
                        height: 40,
                        label: "hello"
                    },
                    {
                        id: "node2",
                        shape: "ellipse",
                        x: 240,
                        y: 300,
                        width: 80,
                        height: 40,
                        label: "world"
                    }
                ],
                edges: [
                    {
                        source: "node1",
                        target: "node2",
                        shape: "double-edge"
                    }
                ]
            };
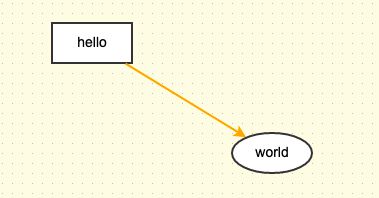
7. 定制边样式
可以使用 attrs 对象来配置边的样式
<template>
    <div>
        <button @click="enlarge">缩小button>
        <button @click="narrow">缩小button>
        <button @click="move">平移button>
        <div id="container" />
    div>
template>
<script>
import { Graph } from "@antv/x6";
export default {
    name: "",
    data() {
        return {
            graph: {}
        };
    },
    mounted() {
        this.initGraph();
    },
    methods: {
        initGraph() {
            // 1. 节点 nodes 和边 edges 字段 的 JSON 数据
            const data = {
                // 节点
                nodes: [
                    {
                        id: "node1",
                        shape: "rect",
                        x: 100,
                        y: 100,
                        width: 80,
                        height: 40,
                        label: "hello"
                    },
                    {
                        id: "node2",
                        shape: "ellipse",
                        x: 240,
                        y: 300,
                        width: 80,
                        height: 40,
                        label: "world"
                    }
                ],
                edges: [
                    {
                        source: "node1",
                        target: "node2",
                        attrs: {
                            line: {
                                stroke: "orange"
                            }
                        }
                    }
                ]
            };

            // 2. 渲染画布
            this.graph = new Graph({
                container: document.getElementById("container"),
                width: 800,
                height: 600,
                background: {
                    color: "#fffbe6" // 设置画布背景颜色
                },
                grid: {
                    size: 10, // 网格大小 10px
                    visible: true // 渲染网格背景
                }
            });

            // 3. 渲染我们的节点和边
            this.graph.fromJSON(data);
        },
        enlarge() {
            this.graph.zoom(-0.5);
        },
        narrow() {
            this.graph.zoom(0.5);
        },
        move() {
            this.graph.translate(80, 40);
        }
    }
};
script>
三、场景实例
1. ER 图

代码结构:
<template>
    <div id="container" />
template>
<script>
import { Graph, Cell, Shape } from "@antv/x6";
import dataEr from "./er.json";
export default {
    name: "",
    data() {
        return {};
    },
    mounted() {
        this.initGraph();
    },
    methods: {
        initGraph() {
            const LINE_HEIGHT = 24;
            const NODE_WIDTH = 150;

            Graph.registerPortLayout(
                "erPortPosition",
                portsPositionArgs => {
                    return portsPositionArgs.map((_, index) => {
                        return {
                            position: {
                                x: 0,
                                y: (index + 1) * LINE_HEIGHT
                            },
                            angle: 0
                        };
                    });
                },
                true
            );

            Graph.registerNode(
                "er-rect",
                {
                    inherit: "rect",
                    markup: [
                        {
                            tagName: "rect",
                            selector: "body"
                        },
                        {
                            tagName: "text",
                            selector: "label"
                        }
                    ],
                    attrs: {
                        rect: {
                            strokeWidth: 1,
                            stroke: "#5F95FF",
                            fill: "#5F95FF"
                        },
                        label: {
                            fontWeight: "bold",
                            fill: "#ffffff",
                            fontSize: 12
                        }
                    },
                    ports: {
                        groups: {
                            list: {
                                markup: [
                                    {
                                        tagName: "rect",
                                        selector: "portBody"
                                    },
                                    {
                                        tagName: "text",
                                        selector: "portNameLabel"
                                    },
                                    {
                                        tagName: "text",
                                        selector: "portTypeLabel"
                                    }
                                ],
                                attrs: {
                                    portBody: {
                                        width: NODE_WIDTH,
                                        height: LINE_HEIGHT,
                                        strokeWidth: 1,
                                        stroke: "#5F95FF",
                                        fill: "#EFF4FF",
                                        magnet: true
                                    },
                                    portNameLabel: {
                                        ref: "portBody",
                                        refX: 6,
                                        refY: 6,
                                        fontSize: 10
                                    },
                                    portTypeLabel: {
                                        ref: "portBody",
                                        refX: 95,
                                        refY: 6,
                                        fontSize: 10
                                    }
                                },
                                position: "erPortPosition"
                            }
                        }
                    }
                },
                true
            );

            const graph = new Graph({
                container: document.getElementById("container"),
                width: 800,
                height: 600,
                background: {
                    color: "#fffbe6" // 设置画布背景颜色
                },
                grid: {
                    size: 10, // 网格大小 10px
                    visible: true // 渲染网格背景
                },
                connecting: {
                    router: {
                        name: "er",
                        args: {
                            offset: 25,
                            direction: "H"
                        }
                    },
                    createEdge() {
                        return new Shape.Edge({
                            attrs: {
                                line: {
                                    stroke: "#A2B1C3",
                                    strokeWidth: 2
                                }
                            }
                        });
                    }
                }
            });
            // 遍历数据
            const cells = [];
            dataEr.forEach(item => {
                if (item.shape === "edge") {
                    cells.push(graph.createEdge(item));
                } else {
                    cells.push(graph.createNode(item));
                }
            });
            graph.resetCells(cells);
            graph.zoomToFit({ padding: 10, maxScale: 1 });
        }
    }
};
script>
四、疑难点
1. 显示不出来
⑴. 未设置画布大小
            const graph = new Graph({
                container: document.getElementById("container"),
                width: 800,
                height: 600,
                background: {
                    color: "#fffbe6" // 设置画布背景颜色
                },
                grid: {
                    size: 10, // 网格大小 10px
                    visible: true // 渲染网格背景
                },
                // ...
2. fetch
fetch 是向后端发起请求,如果 data 数据可缓存本地,可用 import 引入
import dataEr from "./er.json";

// ...

// fetch('../data/er.json')
  // .then((response) => response.json())
  // .then((data) => {
  dataEr.forEach(item => {

  // ...
未完待续…