MATLAB绘图函数fplot详解
MATLAB绘图函数fplot详解
一、fplot基本语法
fplot不同于plot,主要用来根据函数表达式和自变量所属区间来直接绘制函数曲线,不需要给出像plot需要给出的自变量和因变量的数组,因此当函数表达式已知的情况,使用fplot绘制函数曲线相对简单一些。
其基本语法如下:
1)fplot( f, xinterval, s )
其中f是函数中关于自变量的表达式,xinterval是自变量的取值范围,s表示图元的属性,和plot中的图元属性类似。当xinterval缺省的时候,自变量的默认区间是[-5, 5]。
2)fplot( fx, fy, tinterval, s )
此种形式主要用于绘制参数方程表示的函数曲线。其中fx和fy分别表示x和y关于参数t的表达式,tinterval是参数t的取值范围,s表示图元的属性。
3)fplot( @(var) f(var), xinterval, s )
其中@(var) 是声明var为自变量(可以根据需要给定该标识符),f(var)是具体的函数表达式,xinterval是自变量的取值范围,s表示图元的属性。
4)fplot( @(t)fx(t), @(t) fy(t), tinterval, s )
其中@(t) 是声明t为参数(可以根据需要给定该标识符),fx(t)和fy(t)是具体的参数方程横坐标和纵坐标的表达式,tinterval是参数t的取值范围,s表示图元的属性。
注意:用法1)和2)在新版本中会有告警提示。3)和4)是新版本中的标准用法。
二、具体的示例
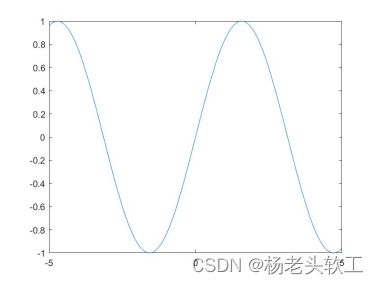
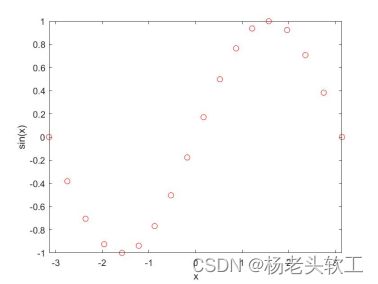
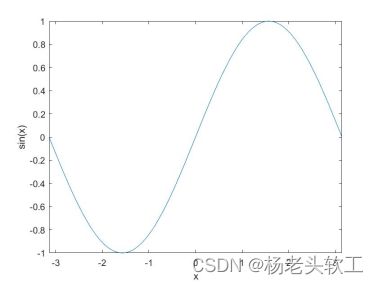
例1.绘制y=sin(x)曲线图。
%示例代码(1)
clear all
clc
fplot( 'sin(x)' ) %只给定了函数表达式
%示例代码(2)
clear all
clc
fplot( 'sin(x)',[ -pi, pi ], 'ro' )
xlabel( 'x' );
ylabel( 'sin(x)' );
%示例代码(3)
clear all
clc
fplot( @(x)sin(x),[ -pi, pi ] )
xlabel( 'x' );
ylabel( 'sin(x)' );
%运行结果
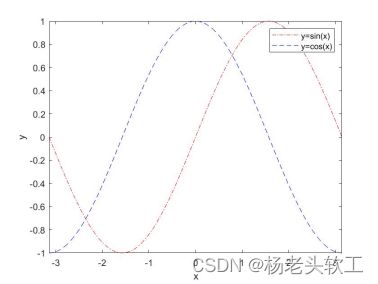
例2.在同一个窗口绘制一个周期内的正弦曲线和余弦曲线
%示例代码
clear all
clc
fplot( @(x)sin(x),[ -pi, pi ], 'r-.' )
hold on
fplot( @(x)cos(x),[ -pi, pi ], 'b--' )
xlabel( 'x' );
ylabel( 'y' );
legend( 'y=sin(x)', 'y=cos(x)' );
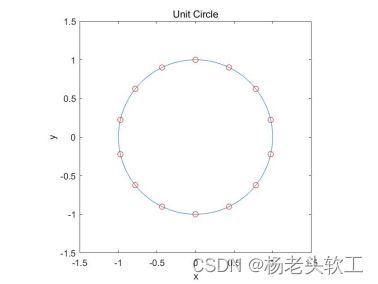
例3.绘制单位圆
%示例代码
clear all
clc
fplot( @(t)sin(t), @(t)cos(t),[ -pi, pi ] ) %实线单位圆
hold on
fplot( @(t)sin(t), @(t)cos(t),[ -pi, pi ], 'ro' ) %单位圆的散点图
xlabel( 'x' );
ylabel( 'y' );
title( 'Unit Circle' );
axis equal
axis( [ -1.5, 1.5, -1.5, 1.5 ] );
%示例代码
clear all
clc
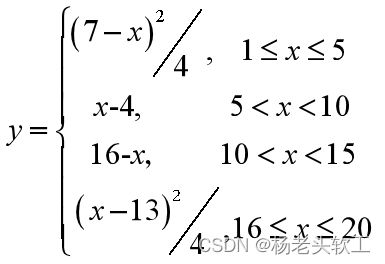
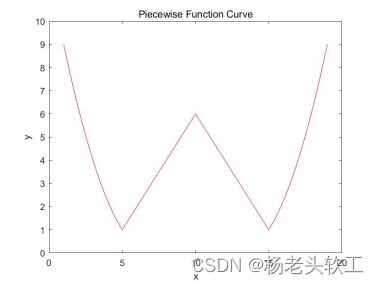
fplot( @(x)(7-x).^2/4,[1, 5 ], 'r' )
hold on
fplot( @(x)x-4,[5, 10 ], 'r' )
fplot( @(x)16-x,[10, 15 ], 'r' )
fplot( @(x)(x-13).^2/4,[15, 19 ], 'r' )
xlabel( 'x' );
ylabel( 'y' );
title( 'Piecewise Function Curve' );
axis( [ 0, 20, 0, 10 ] );
