通过EEMD进行心脏频率和心电图信号去噪(Matlab代码实现)
目录
1 概述
2 运行结果
3 参考文献
4 Matlab代码
1 概述
本文使用集成经验模式分解和希尔伯特变换的R峰值检测(心脏频率)进行心电图信号去噪。
该项目的目的是通过使用集成经验模式分解的新方法(一种去噪生物信号的新方法)来过滤和去噪生理信号(在这种情况下,选择心脏信号心电图)。此外,使用希尔伯特变换来记录心脏频率。
2 运行结果
3 参考文献
[1]张勇,王介生.基于多分辨率分析的心电图信号去噪算法[J].系统工程与电子技术,2002(12):32-34.
4 Matlab代码
主函数部分代码:
%Final Project. Biosignals processing.
%EMD denoising and R peak detention of ECG signal using Hilbert Transform.
clear all;
close all;
clc;
%% Data Loading
ecg=load ('ecg1.mat'); % loading the signal
ecg=struct2cell(ecg);
ecg=cell2mat(ecg);
ecg = (ecg - 1024)/200; % you have to remove "base" and "gain"
ecg1=ecg(1,:); %Noisy ecg
ecg2=ecg(2,:); %filtered ecg
Fs =500; % sampling frequecy
t =linspace(0,length(ecg1)/Fs,length(ecg1)); %time vector
%% ECG signal denoising
imf=eemd(ecg1,.2,70); %Apply the EEMD to the noisy signal .2->ratio of the standard deviation 70->ensemble number
imfs=imf'; %transpose the imf's matrix
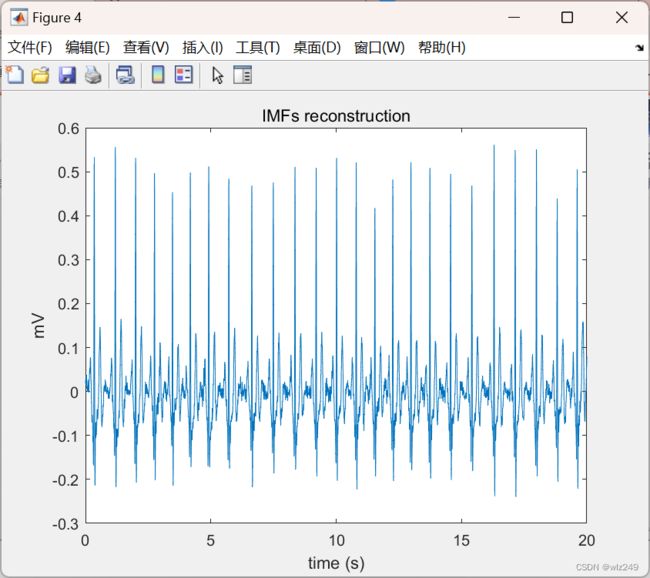
reconstruction=imfs(4,:)+imfs(5,:)+imfs(6,:); %We consider that these 3 imf's possess the important information
%4 order Butterworth filter bandpass .05-230Hz.
fclowpass=230; % Low pass cut-off frequency 230Hz
fchighpass=.05; % Low pass cut-off frequency .05Hz
filterorder=4; %filter order
[b,a]=butter(filterorder,[filterorder*fchighpass/Fs,2*fclowpass/Fs]);
filtered_ECG=filter(b,a,reconstruction);
%% Emphasizing R peaks of the ECG
%Getting the maxima and minima of the ECG signal, to emphasize the R peaks
decg=(1/Fs)*(diff(filtered_ECG)); %derivative of the ecg
hecg=hilbert(decg); %hilbert transform of the derivative.
envelope=abs(hecg); %It returns the envelope of the ecg
%% R peaks detection
maximum=(max(envelope));
Threshold=.6*(maximum);
[pks,locs] = findpeaks(envelope,'MinPeakHeight',Threshold);
time=(1/Fs)*length(ecg1);
timefactor=60/time;
cardiacFreq=round(timefactor*length(pks));
%% Plots
figure (1)
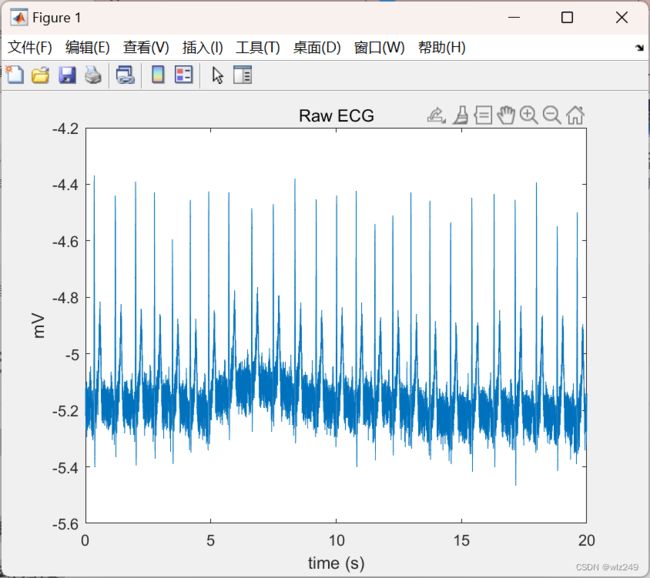
plot(t,ecg1); xlabel('time (s)'); ylabel('mV'); title('Raw ECG');
figure(2)
subplot(7,1,1);
plot(t,imfs(1,:)); xlabel('time (s)'); ylabel('mV'); title('Original ECG');
subplot(7,1,2);
plot(t,imfs(2,:)); xlabel('time (s)'); ylabel('mV'); title('1st IMF');
subplot(7,1,3);
plot(t,imfs(3,:)); xlabel('time (s)'); ylabel('mV'); title('2nd IMF');
subplot(7,1,4);
plot(t,imfs(4,:)); xlabel('time (s)'); ylabel('mV'); title('3rd IMF');
subplot(7,1,5);
plot(t,imfs(5,:)); xlabel('time (s)'); ylabel('mV'); title('4th IMF');
subplot(7,1,6);
plot(t,imfs(6,:)); xlabel('time (s)'); ylabel('mV'); title('5th IMF');
subplot(7,1,7);
plot(t,imfs(7,:)); xlabel('time (s)'); ylabel('mV'); title('6th IMF');
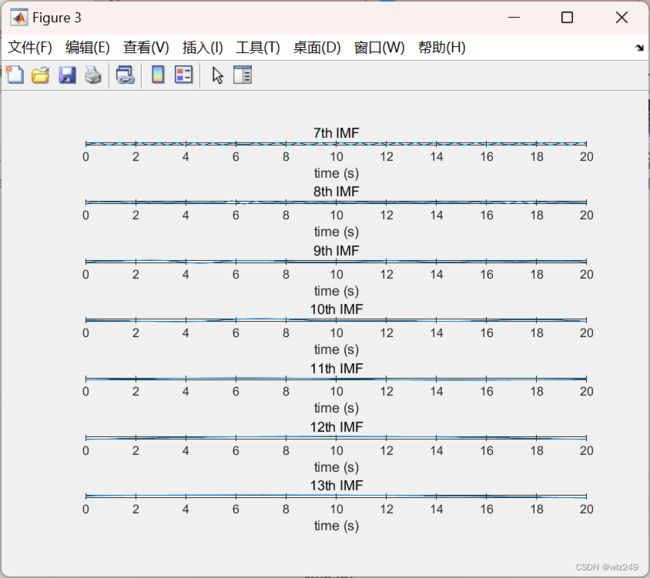
figure (3)
subplot(7,1,1);
plot(t,imfs(8,:)); xlabel('time (s)'); ylabel('mV'); title('7th IMF');
subplot(7,1,2);
plot(t,imfs(9,:)); xlabel('time (s)'); ylabel('mV'); title('8th IMF');
subplot(7,1,3);
plot(t,imfs(10,:)); xlabel('time (s)'); ylabel('mV'); title('9th IMF');
subplot(7,1,4);
plot(t,imfs(11,:)); xlabel('time (s)'); ylabel('mV'); title('10th IMF');
subplot(7,1,5);
plot(t,imfs(12,:)); xlabel('time (s)'); ylabel('mV'); title('11th IMF');
subplot(7,1,6);
plot(t,imfs(13,:)); xlabel('time (s)'); ylabel('mV'); title('12th IMF');
subplot(7,1,7);
plot(t,imfs(14,:)); xlabel('time (s)'); ylabel('mV'); title('13th IMF');
figure (4)
plot(t,reconstruction); xlabel('time (s)'); ylabel('mV'); title('IMFs reconstruction');
figure(5)
plot(t,filtered_ECG); xlabel('time (s)'); ylabel('mV'); title('Filtered ECG (IMF+bandPass)');
figure(6)
plot(t(1:9999),decg); xlabel('time (s)'); ylabel('d(ECG)/dt'); title('ECG derivative');
figure(7)
plot(t(1:9999),hecg); xlabel('time (s)'); ylabel('H(d(ECG)/dt)'); title('Hilbert Transform of derivate');
figure(8)
plot(t(1:9999),envelope); xlabel('time (s)'); ylabel('B(d(ECG)/dt)'); title('Envelope');
figure (9)
plot(t(1:9999),envelope,locs,pks,'or');
legend('ECG','R peaks','Location','NorthWest');


