pandas教程02---Series处理时间
文章目录
- 欢迎关注公众号【Python开发实战】,免费领取Python学习电子书!
- 工具-pandas
-
- 处理时间
-
- 时间范围
- 重采样
- 上采样和插值
- 时区
- 时期
欢迎关注公众号【Python开发实战】,免费领取Python学习电子书!
工具-pandas
pandas库提供了高性能、易于使用的数据结构和数据分析工具。其主要数据结构是DataFrame,可以将DataFrame看做内存中的二维表格,如带有列名和行标签的电子表格。许多在Excel中可用的功能都可以通过编程实现,例如创建数据透视表、基于其他列计算新列的值、绘制图形等。还可以按照列的值对行进行分组,或者像SQL中那样连接表格。pandas也擅长处理时间序列。
但是介绍pandas之前,需要有numpy的基础,如果还不熟悉numpy,可以查看numpy快速入门教程。
导入pandas
import pandas as pd
处理时间
许多数据集都有时间戳,pandas在处理此类数据方面也非常出色:
- 它可以表示时期(如2016年第三季度)和频率(如每月)。
- 它可以将时期转换为实际的时间戳,反之亦然。
- 它可以按照任何方式对数据进行重采样和聚合。
- 它可以处理时区。
时间范围
可以使用pd.date_range()创建一个时间Series,它会返回一个DatetimeIndex,现在创建一个DatetimeIndex,内容为从2021年10月29日下午5:30开始的12小时内每小时的一个datetime。
dates = pd.date_range('2016/10/29 5:30pm', periods=12, freq='H')
dates
输出:
DatetimeIndex(['2016-10-29 17:30:00', '2016-10-29 18:30:00',
               '2016-10-29 19:30:00', '2016-10-29 20:30:00',
               '2016-10-29 21:30:00', '2016-10-29 22:30:00',
               '2016-10-29 23:30:00', '2016-10-30 00:30:00',
               '2016-10-30 01:30:00', '2016-10-30 02:30:00',
               '2016-10-30 03:30:00', '2016-10-30 04:30:00'],
              dtype='datetime64[ns]', freq='H')
DatetimeIndex可以用作Series的索引标签。
temp_series = pd.Series(temperatures, index=dates)
temp_series
输出:
2016-10-29 17:30:00    4.4
2016-10-29 18:30:00    5.1
2016-10-29 19:30:00    6.1
2016-10-29 20:30:00    6.2
2016-10-29 21:30:00    6.1
2016-10-29 22:30:00    6.1
2016-10-29 23:30:00    5.7
2016-10-30 00:30:00    5.2
2016-10-30 01:30:00    4.7
2016-10-30 02:30:00    4.1
2016-10-30 03:30:00    3.9
2016-10-30 04:30:00    3.5
Freq: H, dtype: float64
现在绘制一下这个Series。
temp_series.plot(kind='bar')
plt.grid(True)
plt.show()
重采样
pandas可以非常简单地对时间Series进行重采样。只需要调用resample()方法并制定一个新的频率。
temp_series_freq_2H = temp_series.resample('2H')
temp_series_freq_2H
输出:
DatetimeIndexResampler [freq=<2 * Hours>, axis=0, closed=left, label=left, convention=start, base=0]
重采样操作实际上是一个延迟操作,这就是为什么没有得到一个Series对象,而是一个DatetimeIndexResampler对象。为了实际执行重采样操作,可以调用mean()方法,pandas会计算每对连续小时的平均值。
temp_series_freq_2H = temp_series_freq_2H.mean()
temp_series_freq_2H
输出:
2016-10-29 16:00:00    4.40
2016-10-29 18:00:00    5.60
2016-10-29 20:00:00    6.15
2016-10-29 22:00:00    5.90
2016-10-30 00:00:00    4.95
2016-10-30 02:00:00    4.00
2016-10-30 04:00:00    3.50
Freq: 2H, dtype: float64
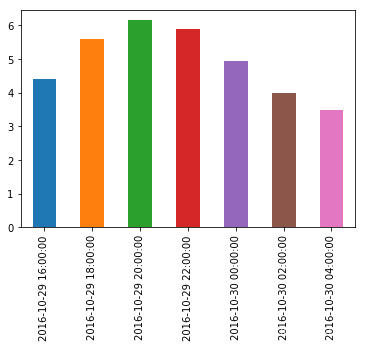
现在绘制一下结果。
temp_series_freq_2H.plot(kind='bar')
plt.show()
请注意,这些值是如何自动聚合为以2小时为一个时期的。例如,看一下下午6-8点的时间段,在下午6.30时的值为5.1, 在晚上7.30时的值为6.1,重新采样后只有一个值5.6,即5.1和6.1的平均值。除了计算平均值,还可以使用其他的聚合函数,例如可以保持每个时期的最小值。
temp_series_freq_2H = temp_series.resample('2H').min()
temp_series_freq_2H
输出:
2016-10-29 16:00:00    4.4
2016-10-29 18:00:00    5.1
2016-10-29 20:00:00    6.1
2016-10-29 22:00:00    5.7
2016-10-30 00:00:00    4.7
2016-10-30 02:00:00    3.9
2016-10-30 04:00:00    3.5
Freq: 2H, dtype: float64
还可以使用apply方法。
temp_series_freq_2H = temp_series.resample('2H').apply(np.min)
temp_series_freq_2H
输出:
2016-10-29 16:00:00    4.4
2016-10-29 18:00:00    5.1
2016-10-29 20:00:00    6.1
2016-10-29 22:00:00    5.7
2016-10-30 00:00:00    4.7
2016-10-30 02:00:00    3.9
2016-10-30 04:00:00    3.5
Freq: 2H, dtype: float64
上采样和插值
上面是一个下采样的例子。也可以增加采样(即增加频率),但这会在数据中造成缺失。
temp_series_freq_15min = temp_series.resample('15Min').mean()
temp_series_freq_15min.head(10)    # head(10)显示前10个数据
输出:
2016-10-29 17:30:00    4.4
2016-10-29 17:45:00    NaN
2016-10-29 18:00:00    NaN
2016-10-29 18:15:00    NaN
2016-10-29 18:30:00    5.1
2016-10-29 18:45:00    NaN
2016-10-29 19:00:00    NaN
2016-10-29 19:15:00    NaN
2016-10-29 19:30:00    6.1
2016-10-29 19:45:00    NaN
Freq: 15T, dtype: float64
可以通过差值来填补缺失值。只需要调用interpolate()方法,默认情况下使用线性插值,但是可以选择其他方法,例如立方插值。
temp_series_freq_15min = temp_series.resample('15Min').interpolate(method='cubic')
temp_series_freq_15min.head(10)
输出:
2016-10-29 17:30:00    4.400000
2016-10-29 17:45:00    4.452911
2016-10-29 18:00:00    4.605113
2016-10-29 18:15:00    4.829758
2016-10-29 18:30:00    5.100000
2016-10-29 18:45:00    5.388992
2016-10-29 19:00:00    5.669887
2016-10-29 19:15:00    5.915839
2016-10-29 19:30:00    6.100000
2016-10-29 19:45:00    6.203621
Freq: 15T, dtype: float64
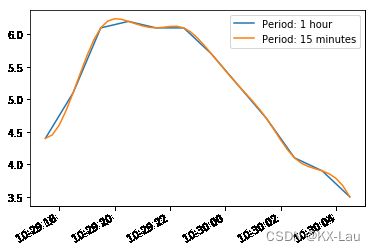
temp_series.plot(label='Period: 1 hour')
temp_series_freq_15min.plot(label='Period: 15 minutes')
plt.legend()
plt.show()
时区
默认情况下,日期时间是无知的:它们不知道时区,所以2021-10-30 02:30可能是巴黎时间也可能是纽约时间。可以通过调用tz_localize()方法来识别日期时间的时区。
temp_series_ny = temp_series.tz_localize('America/New_York')
temp_series_ny
输出:
2016-10-29 17:30:00-04:00    4.4
2016-10-29 18:30:00-04:00    5.1
2016-10-29 19:30:00-04:00    6.1
2016-10-29 20:30:00-04:00    6.2
2016-10-29 21:30:00-04:00    6.1
2016-10-29 22:30:00-04:00    6.1
2016-10-29 23:30:00-04:00    5.7
2016-10-30 00:30:00-04:00    5.2
2016-10-30 01:30:00-04:00    4.7
2016-10-30 02:30:00-04:00    4.1
2016-10-30 03:30:00-04:00    3.9
2016-10-30 04:30:00-04:00    3.5
Freq: H, dtype: float64
请注意,-04:00是附加到所有的日期时间上,这意味着这些日期时间指的是UTC-04小时。现在可以将这些日期时间转为巴黎时间。
temp_series_paris = temp_series_ny.tz_convert('Europe/Paris')
temp_series_paris
输出:
2016-10-29 23:30:00+02:00    4.4
2016-10-30 00:30:00+02:00    5.1
2016-10-30 01:30:00+02:00    6.1
2016-10-30 02:30:00+02:00    6.2
2016-10-30 02:30:00+01:00    6.1
2016-10-30 03:30:00+01:00    6.1
2016-10-30 04:30:00+01:00    5.7
2016-10-30 05:30:00+01:00    5.2
2016-10-30 06:30:00+01:00    4.7
2016-10-30 07:30:00+01:00    4.1
2016-10-30 08:30:00+01:00    3.9
2016-10-30 09:30:00+01:00    3.5
Freq: H, dtype: float64
上面的结果里面UTC偏移量从+02:00变为+01:00,这是因为法国在该特定的夜晚的凌晨3点切换到冬季时间了(时间回到凌晨2点)。请注意,凌晨2:30出现了两次!现在回到一个简单的表示,使用本地时间每小时记录这些数据,而不是存储时区,可能会得到一下结果。
temp_series_paris_native = temp_series_paris.tz_localize(None)
temp_series_paris_native
输出:
2016-10-29 23:30:00    4.4
2016-10-30 00:30:00    5.1
2016-10-30 01:30:00    6.1
2016-10-30 02:30:00    6.2
2016-10-30 02:30:00    6.1
2016-10-30 03:30:00    6.1
2016-10-30 04:30:00    5.7
2016-10-30 05:30:00    5.2
2016-10-30 06:30:00    4.7
2016-10-30 07:30:00    4.1
2016-10-30 08:30:00    3.9
2016-10-30 09:30:00    3.5
Freq: H, dtype: float64
现在02:30很模糊,如果试图将这些日期时间定位到巴黎时区,将会得到一个错误。
try:
    temp_series_paris_native.tz_localize('Europe/Paris')
except Exception as e:
    print(type(e))
    print(e)
输出:
Cannot infer dst time from '2016-10-30 02:30:00', try using the 'ambiguous' argument
使用ambiguous参数,可以告诉pandas根据模糊时间戳的顺序推断出正确的DST(夏令时)。
temp_series_paris_native.tz_localize('Europe/Paris', ambiguous='infer')
输出:
2016-10-29 23:30:00+02:00    4.4
2016-10-30 00:30:00+02:00    5.1
2016-10-30 01:30:00+02:00    6.1
2016-10-30 02:30:00+02:00    6.2
2016-10-30 02:30:00+01:00    6.1
2016-10-30 03:30:00+01:00    6.1
2016-10-30 04:30:00+01:00    5.7
2016-10-30 05:30:00+01:00    5.2
2016-10-30 06:30:00+01:00    4.7
2016-10-30 07:30:00+01:00    4.1
2016-10-30 08:30:00+01:00    3.9
2016-10-30 09:30:00+01:00    3.5
Freq: H, dtype: float64
时期
period_range()函数返回一个PeriodIndex,不是DatetimeIndex。例如,现在创建一个PeriodIndex,内容为2016和2017年所有的季度。
quarters = pd.period_range('2016Q1', periods=8, freq='Q')
quarters
输出:
PeriodIndex(['2016Q1', '2016Q2', '2016Q3', '2016Q4', '2017Q1', '2017Q2',
             '2017Q3', '2017Q4'],
            dtype='period[Q-DEC]', freq='Q-DEC')
将一个数字N加到PeriodIndex上,会将时期移动N倍的PeriodIndex频率。
quarters + 3
输出:
PeriodIndex(['2016Q4', '2017Q1', '2017Q2', '2017Q3', '2017Q4', '2018Q1',
             '2018Q2', '2018Q3'],
            dtype='period[Q-DEC]', freq='Q-DEC')
asfreq()方法可以改变PeriodIndex的频率。所有的时期都会相应地延长或缩短。例如,将quarters季度时期转换为月度时期,即放大了时期。
quarters.asfreq(freq='M')
输出:
PeriodIndex(['2016-03', '2016-06', '2016-09', '2016-12', '2017-03', '2017-06',
             '2017-09', '2017-12'],
            dtype='period[M]', freq='M')
默认情况下,asfreq是在每个时期结束时缩放。可以设置为在每个时期开始时缩放,即设置how参数为start或S。
quarters.asfreq(freq='M', how='S')
输出:
PeriodIndex(['2016-01', '2016-04', '2016-07', '2016-10', '2017-01', '2017-04',
             '2017-07', '2017-10'],
            dtype='period[M]', freq='M')
还可以缩小时期。
quarters.asfreq('A') # A表示频率为年
输出:
PeriodIndex(['2016', '2016', '2016', '2016', '2017', '2017', '2017', '2017'], dtype='period[A-DEC]', freq='A-DEC')
当然,可以根据PeriodIndex创建一个Series。
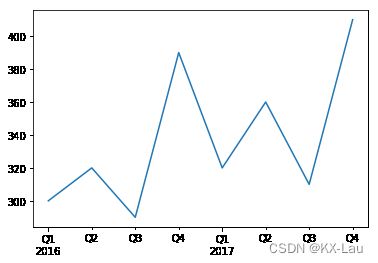
quartersua_revenue = pd.Series([300, 320, 290, 390, 320, 360, 310, 410], index=quarters)
quartersua_revenue
输出:
2016Q1    300
2016Q2    320
2016Q3    290
2016Q4    390
2017Q1    320
2017Q2    360
2017Q3    310
2017Q4    410
Freq: Q-DEC, dtype: int64
quartersua_revenue.plot(kind='line')
plt.show()
可以通过调用时间Series的to_timestamp方法将时期转换为时间戳。默认情况下,转换为每个时期的第一天,但可以通过设置how和freq两个参数,获得每个时期的最后一个小时。
last_hours = quartersua_revenue.to_timestamp(freq='H', how='E')
last_hours
输出:
2016-03-31 23:00:00    300
2016-06-30 23:00:00    320
2016-09-30 23:00:00    290
2016-12-31 23:00:00    390
2017-03-31 23:00:00    320
2017-06-30 23:00:00    360
2017-09-30 23:00:00    310
2017-12-31 23:00:00    410
Freq: Q-DEC, dtype: int64
现在想将时间戳转换为时期,可以通过调用to_period方法。
last_hours.to_period()
输出:
2016Q1    300
2016Q2    320
2016Q3    290
2016Q4    390
2017Q1    320
2017Q2    360
2017Q3    310
2017Q4    410
Freq: Q-DEC, dtype: int64
这里还有一个例子,就是获取由2016年每个月的最后一个工作日的上午九点组成的PeriodIndex。
months_2016 = pd.period_range('2016', periods=12, freq='M')
months_2016
输出:
PeriodIndex(['2016-01', '2016-02', '2016-03', '2016-04', '2016-05', '2016-06',
             '2016-07', '2016-08', '2016-09', '2016-10', '2016-11', '2016-12'],
            dtype='period[M]', freq='M')
one_day_after_last_days = months_2016.asfreq(freq='D', how='E')
one_day_after_last_days
输出:
PeriodIndex(['2016-01-31', '2016-02-29', '2016-03-31', '2016-04-30',
             '2016-05-31', '2016-06-30', '2016-07-31', '2016-08-31',
             '2016-09-30', '2016-10-31', '2016-11-30', '2016-12-31'],
            dtype='period[D]', freq='D')
one_day_after_last_days = one_day_after_last_days + 1
one_day_after_last_days
输出:
PeriodIndex(['2016-02-01', '2016-03-01', '2016-04-01', '2016-05-01',
             '2016-06-01', '2016-07-01', '2016-08-01', '2016-09-01',
             '2016-10-01', '2016-11-01', '2016-12-01', '2017-01-01'],
            dtype='period[D]', freq='D')
one_day_after_last_days.to_timestamp()
输出:
DatetimeIndex(['2016-02-01', '2016-03-01', '2016-04-01', '2016-05-01',
               '2016-06-01', '2016-07-01', '2016-08-01', '2016-09-01',
               '2016-10-01', '2016-11-01', '2016-12-01', '2017-01-01'],
              dtype='datetime64[ns]', freq='MS')
last_b_days = one_day_after_last_days.to_timestamp() - pd.tseries.offsets.BDay()
last_b_days
输出:
DatetimeIndex(['2016-01-29', '2016-02-29', '2016-03-31', '2016-04-29',
               '2016-05-31', '2016-06-30', '2016-07-29', '2016-08-31',
               '2016-09-30', '2016-10-31', '2016-11-30', '2016-12-30'],
              dtype='datetime64[ns]', freq='BM')
last_b_days.to_period('H') + 9
输出:
PeriodIndex(['2016-01-29 09:00', '2016-02-29 09:00', '2016-03-31 09:00',
             '2016-04-29 09:00', '2016-05-31 09:00', '2016-06-30 09:00',
             '2016-07-29 09:00', '2016-08-31 09:00', '2016-09-30 09:00',
             '2016-10-31 09:00', '2016-11-30 09:00', '2016-12-30 09:00'],
            dtype='period[H]', freq='H')
07-29’, ‘2016-08-31’,
‘2016-09-30’, ‘2016-10-31’, ‘2016-11-30’, ‘2016-12-30’],
dtype=‘datetime64[ns]’, freq=‘BM’)
last_b_days.to_period('H') + 9
输出:
PeriodIndex(['2016-01-29 09:00', '2016-02-29 09:00', '2016-03-31 09:00',
             '2016-04-29 09:00', '2016-05-31 09:00', '2016-06-30 09:00',
             '2016-07-29 09:00', '2016-08-31 09:00', '2016-09-30 09:00',
             '2016-10-31 09:00', '2016-11-30 09:00', '2016-12-30 09:00'],
            dtype='period[H]', freq='H')


