如何根据光学中像差(相位)求出其点扩散函数
1.利用Matlab求某个zernike模式的PSF(点扩散函数)图像
clear all;close all;clc
% 1.空域内的参数
psf_sampling      = 0.5e-6;              % focal plane sampling in meters
lambda            = 0.6328e-6;           % 波长,[米]
N                 = 256;                 % 采样点
aperture_diameter = 0.0254;              % 孔径[m]; 1 英寸
focal_length      = 5*aperture_diameter; % 焦距[m]
RMS_SA            = 1;                   % RMS spherical aberration content in waves

% 2.定义频域内的参数,为将要进行的傅里叶变换做准备
delta_fx          = 1/(psf_sampling*N);  % 频域内相邻采样点的间距
% 波长*焦距*频率间距 = FTP{瞳孔函数}=h(xi,yi);  fx = xi/λ/f; 故:xi = λffx;
x_pupil           = (-fix(N/2):fix((N-1)/2)) * delta_fx * lambda * focal_length; % 像面上的x轴范围
[X_pupil,Y_pupil] = meshgrid(x_pupil);             % 像面上的积分区域
R_pupil           = sqrt(X_pupil.^2 + Y_pupil.^2); % 直角坐标换成极坐标,极径
Theta             = atan2(X_pupil,Y_pupil);        % 极角
R_norm            = R_pupil/(aperture_diameter/2); % 归一化
assert(max(R_norm(:))>=sqrt(2),'Sampling is not sufficient to reconstruct the entire wavefront.');

% figure(1);imagesc(R_norm);colormap(jet);colorbar;

% 3.求出极坐标下某个Zernike模式的符号表达式
j     = 5; % 第j和模式
[n,m] = Noll_to_Zernike(j);
[Zer_pol{1,1},Zer_pol{2,1},...
 Zer_pol{3,1},Zer_pol{4,1}] = Zernike_string_polynomial(n,-m); % 调用求导后极坐标下的Zernike多项式
W     = num2str(['RMS_SA *', Zer_pol{4,1}]); % 乘一个系数RMS_SA

W1    = W;
x                 = linspace(-1,1,90);
[X_pupil,Y_pupil] = meshgrid(x,x);     % 像面上的积分区域
r     = sqrt(X_pupil.^2 + Y_pupil.^2); % 直角坐标换成极坐标,极径
t     = atan2(X_pupil,Y_pupil);        % 极角
W1    = eval(W1) .*(r<=1) ;            % 带入具体的值 得到畸变波前的相位值


r     = R_norm;
t     = Theta;
W     = eval(W);        % 带入具体的值 得到畸变波前的相位值
W(R_norm>1) = 0;
W     = W';
Tit   = ['第', num2str(j),'个Zernike模式'];
% figure(2);imagesc(W);colormap(jet);colorbar;title(Tit)

E           = exp(sqrt(-1)*2*pi*W);  % Complex amplitude 电磁波的表达形式
E(R_norm>1) = 0;                     % Impose aperture size
x_1 = (-fix(N/2):fix((N-1)/2)) * psf_sampling;
figure(3);imagesc(x_1*1e6,x_1*1e6,angle(E)/(2*pi));
colormap(jet);colorbar;title('Wavefront Phase(waves)');

% 4. 求点扩散函数Create point-spread function
psf     = abs(fftshift(fft2(ifftshift(E)))).^2; % PSF计算公式,
psf     = psf/sum(psf(:));          % 归一化
x_psf   = (-fix(N/2):fix((N-1)/2)) * psf_sampling;
figure(4);imagesc(x_psf*1e6,x_psf*1e6,psf*1e6);colormap(jet);colorbar;
title(sprintf('PSF with %.4f waves RMS of Spherical Aberration', RMS_SA));
xlabel(sprintf('Position (\\mum)'));
ylabel(sprintf('Position (\\mum)'));

figure(16);subplot(121);imagesc(W1');colormap(jet);colorbar;title(Tit)
subplot(122);imagesc(x_psf*1e6,x_psf*1e6,psf*1e6);colormap(jet);colorbar
title(sprintf('PSF with %.4f waves RMS of Spherical Aberration', RMS_SA));
xlabel(sprintf('Position (\\mum)'));
ylabel(sprintf('Position (\\mum)'));
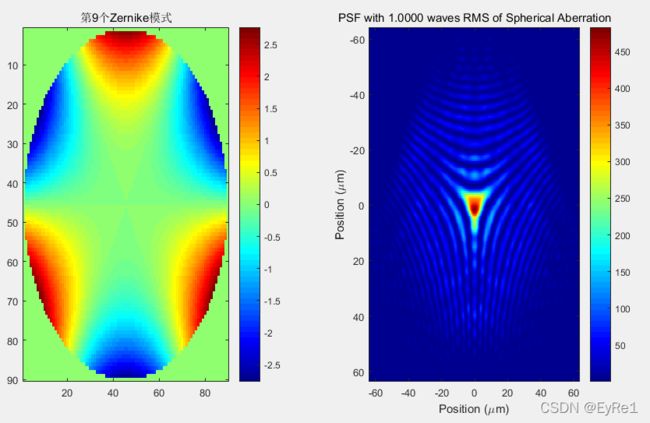
任选两个测试结果如下:
2.利用Matlab求固定像差的PSF(点扩散函数)图像
光学中任意像差都可以通过zernike各个模式的线性叠加而成,即各个模式与对应的系数相乘再求和。
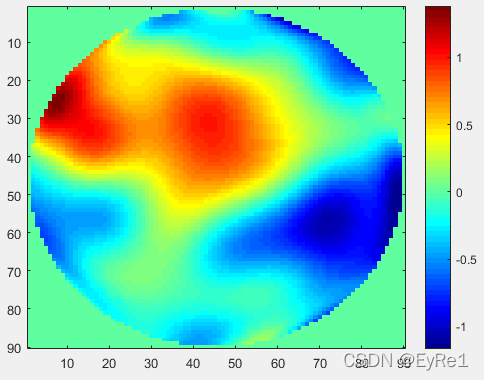
对于一组Zernike系数为A = [0.0108, -0.2564, -0.2082, -0.2147, 0.0780, -0.0405, 0.1682, 0.0239, -0.1976, 0.0085, 0.0606, 0.0450,0.0642, -0.0527, 0.0230, 0.0003, -0.0797, -0.0044, 0.0610, 0.0504, -0.1023, -0.0480, -0.0335, -0.0223,-0.0082, 0.0038, -0.0008, -0.0328, 0.0128, -0.0128, -0.0147, 0.0201, 0.0473, -0.0083, -0.0072, -0.0207,0.0247, -0.0128, 0.0159, 0.0112, -0.0026, -0.0253, -0.0218, -0.0249, -0.0131, 0.0034, 0.0125, -0.0152,-0.0143, -0.0065, -0.0342, -0.0079, 0.0221, 0.0035, -0.0118, -0.0024, -0.0091, 0.0128, -0.0079, -0.0007,0.0177, 0.0084, -0.0023, 0.0225, 0.0003, -0.0151, -0.0068, -0.0013, 0.0187, 0.0257, 0.0215, -0.0004,-0.0173, 0.0034, -0.0096, 0.0098, 0.0330, -0.0141, -0.0024, 0.0005];其与Zernike多项式各个模式相乘、求和后的像差为:
有了像差后,就可以求其PSF了。
psf_sampling      = 0.5e-6;              % focal plane sampling in meters
lambda            = 0.6328e-6;           % 波长,[米]
N                 = 256;                 % 采样点
aperture_diameter = 0.0254;              % meters; 1 inch
focal_length      = 5*aperture_diameter; % 焦距【meters】
RMS_SA            = 1;                   % RMS spherical aberration content in waves

% 2.定义频域内的参数,为将要进行的傅里叶变换做准备
delta_fx          = 1/(psf_sampling*N);  % 频域内相邻采样点的间距
% 波长*焦距*频率间距 = FTP{瞳孔函数}=h(xi,yi);  fx = xi/λ/f; 故:xi = λffx;
x_pupil           = (-fix(N/2):fix((N-1)/2)) * delta_fx * lambda * focal_length; % 像面上的x轴范围
[X_pupil,Y_pupil] = meshgrid(x_pupil);             % 像面上的积分区域
R_pupil           = sqrt(X_pupil.^2 + Y_pupil.^2); % 直角坐标换成极坐标,极径
Theta             = atan2(X_pupil,Y_pupil);        % 极角
R_norm            = R_pupil/(aperture_diameter/2);
assert(max(R_norm(:))>=sqrt(2),'Sampling is not sufficient to reconstruct the entire wavefront.');

% 3.根据Zernike多项式 产生畸变波前的相位值

WW  = [];
coe = A; % 把系数复制过来啊

for i = 1 : 80     % 80个Zernike模式
    [n,m] = Noll_to_Zernike(i); % 调用代码见第一篇和第二篇文章哦
    [~,~,~, Zer_poll{4,1}] = Zernike_string_polynomial(n,-m); % 调用极坐标下的Zernike多项式
    WW = num2str([WW, '(' ,num2str(coe(i)),') *(' ,Zer_poll{4,1},' )' ,' + ']);
    clear Zer_polll
end
W                 = num2str(['RMS_SA *', WW , '0']); % 修正最后一个模式后面的 + 号
W1                = W;
x                 = linspace(-1,1,90);
[X_pupil,Y_pupil] = meshgrid(x,x);                 % 像面上的积分区域
r                 = sqrt(X_pupil.^2 + Y_pupil.^2); % 直角坐标换成极坐标,极径
t                 = atan2(X_pupil,Y_pupil);        % 极角
W1                = eval(W1) .*(r<=1) ;            % 带入具体的值 得到畸变波前的相位值
% figure(15);imagesc(W1');colormap(jet);colorbar;
r                 = R_norm;
t                 = Theta;
W                 = eval(W);        % 带入具体的值 得到畸变波前的相位值
W(R_norm>1)       = 0;
W                 = W';
E                 = exp(sqrt(-1)*2*pi*W);  % Complex amplitude 电磁波的表达形式
E(R_norm>1)       = 0;                     % Impose aperture size
x_1               = (-fix(N/2):fix((N-1)/2)) * psf_sampling;
figure(2);imagesc(x_1*1e6,x_1*1e6,angle(E)/(2*pi));
colormap(jet);colorbar;title('Wavefront Phase(waves)');

% 4. 求点扩散函数Create point-spread function
psf               = abs(fftshift(fft2(ifftshift(E)))).^2; %
psf               = psf/sum(psf(:));   % Normalize to unity energy

x_psf             = (-fix(N/2):fix((N-1)/2)) * psf_sampling;
figure(3);imagesc(x_psf*1e6,x_psf*1e6,psf*1e6);colormap(jet);colorbar;
title(sprintf('PSF with %.4f waves RMS of Spherical Aberration', RMS_SA));
xlabel(sprintf('Position (\\mum)'));
ylabel(sprintf('Position (\\mum)'));

figure(16);subplot(121);imagesc(W1');colormap(jet);colorbar; title('像差,单位um')
subplot(122);imagesc(x_psf*1e6,x_psf*1e6,psf*1e6);colormap(jet);colorbar
title(sprintf('PSF with %.4f waves RMS of Spherical Aberration', RMS_SA));
xlabel(sprintf('Position (\\mum)'));
ylabel(sprintf('Position (\\mum)'));
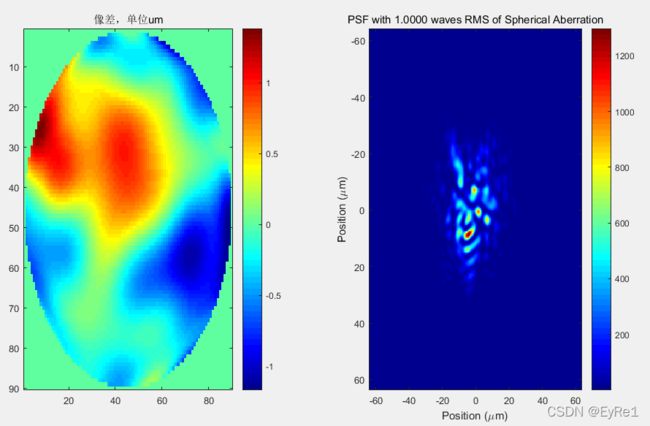
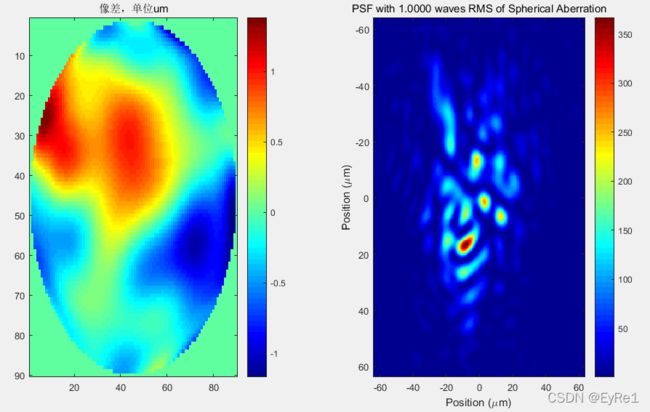
0.632um波长下的测试结果如下:
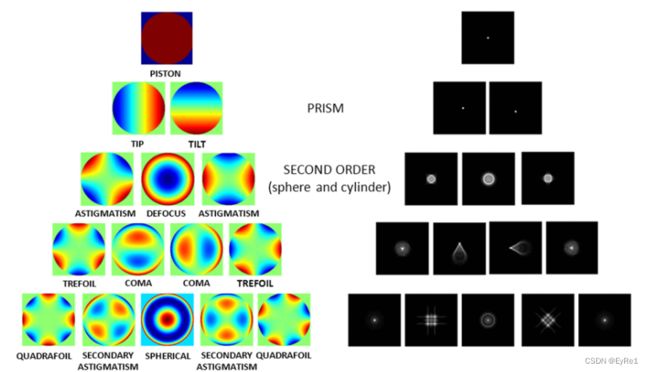
Zernike多项式和其PSF对应关系如下图所示。

