吴恩达第二周编程题
用神经网络思想实现Logistic回归:学习如何建立逻辑回归分类器用来识别猫
1,导入包
import numpy as np
import h5py
import matplotlib.pyplot as plt
import pylab
import scipy.misc
from PIL.Image import Image
from colorcet.plotting import arr
from skimage.transform import resize

from lr_utils import load_dataset
2,lr_utils.py文件
import numpy as np
import h5py


def load_dataset():
    train_dataset = h5py.File('../train_catvnoncat.h5', "r")
    train_set_x_orig = np.array(train_dataset["train_set_x"][:])  # your train set features
    train_set_y_orig = np.array(train_dataset["train_set_y"][:])  # your train set labels

    test_dataset = h5py.File('../test_catvnoncat.h5', "r")
    test_set_x_orig = np.array(test_dataset["test_set_x"][:])  # your test set features
    test_set_y_orig = np.array(test_dataset["test_set_y"][:])  # your test set labels

    classes = np.array(test_dataset["list_classes"][:])  # the list of classes

    train_set_y_orig = train_set_y_orig.reshape((1, train_set_y_orig.shape[0]))
    test_set_y_orig = test_set_y_orig.reshape((1, test_set_y_orig.shape[0]))

    return train_set_x_orig, train_set_y_orig, test_set_x_orig, test_set_y_orig, classes
3,加载数据
train_set_x_orig, train_set_y, test_set_x_orig, test_set_y, classes = load_dataset()4,运行代码,可视化示例
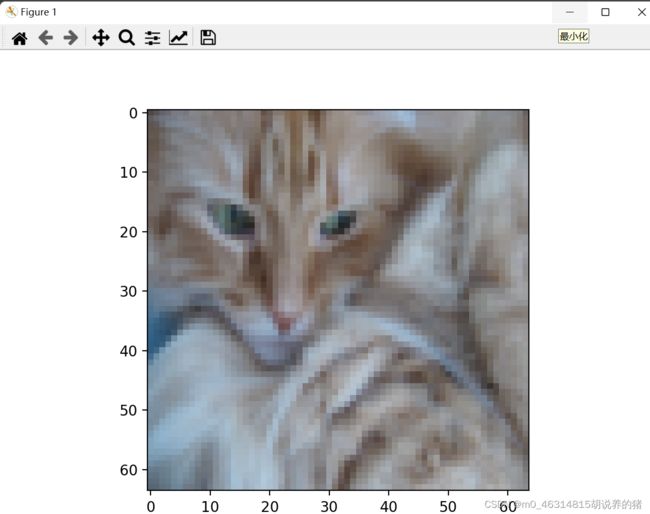
index = 2
plt.imshow(train_set_x_orig[index])
pylab.show()
print("y=" + str(train_set_y[:, index]),
      "it is a " + classes[np.squeeze(train_set_y[:, index])].decode("utf-8") + " picture.")
5,查找以下各值 m_train(训练集示例数量) m_test(测试集示例数量) num_px(训练图像的高度=训练图像的宽度)
m_train = train_set_x_orig.shape[0]
m_test = test_set_x_orig.shape[0]
num_px = train_set_x_orig.shape[1]
print("训练集示例数量:m_train=" + str(m_train))
print("测试集示例数量:m_test" + str(m_test))
print("训练图像的高度/宽度:num_px=" + str(num_px))
print("每个图片的大小:(" + str(num_px) + str(num_px) + ",3)")
print("train_set_y的维度:" + str(test_set_y.shape))
print("train_set_x的维度" + str(train_set_x_orig.shape))
print("test_set_x的维度" + str(test_set_x_orig.shape))
print("test_set_y的维度" + str(test_set_y.shape))
6,重塑训练和测试数据集
train_set_x_flatten = train_set_x_orig.reshape(train_set_x_orig.shape[0], -1).T
test_set_x_flatten = test_set_x_orig.reshape(test_set_x_orig.shape[0], -1).T
print("train_set_x_flatten shape:" + str(train_set_x_flatten.shape))
print("train_set_y shape" + str(train_set_y.shape))
print("test_set_x_flatten shape" + str(test_set_x_flatten.shape))
print("test_set_y shape" + str(test_set_y.shape))
print("重塑后的检查维度" + str(train_set_x_flatten[0:5, 0]))
7,标准化数据集
train_set_x = train_set_x_flatten / 255
test_set_x = test_set_x_flatten / 255
8,预处理数据集常见步骤:
(1)找出数据的尺度和维度,
(2)重塑数据集,使每个示例都是大小为(num_py*num_py*
(3)构建算法的各个部分
建立神经网络:计算当前的损失(正向传播) 计算当前的梯度(向后传播) 更新参数(梯度下降)
构建辅助函数
# 构建辅助函数
def sigmoid(z):
    s = 1 / (1 + np.exp(-z))
    return s


print("sigmoid([0,2])=" + str(sigmoid(np.array([0, 2]))))![]()
# 初始化参数
def initialize_with_zeros(dim):
    w = np.zeros((dim, 1))  # dim为我们想要的w向量的大小(或者是参数)
    b = 0
    assert (w.shape == (dim, 1))  # 断言函数
    assert (isinstance(b, float) or isinstance(b, int))
    return w, b


dim = 5  # 代表w为几维
w, b = initialize_with_zeros(dim)
print("w=" + str(w))
print("b=" + str(b))
# 前向传播和后向传播 使用propagate()来计算损失函数和梯度
def propagate(w, b, X, Y):
    m = X.shape[1]  # m计算X的列数
    A = sigmoid(np.dot(w.T, X) + b)
    cost = -1 / m * np.sum(Y * np.log(A) + (1 - Y) * np.log(1 - A))
    dw = 1 / m * np.dot(X, (A - Y).T)
    db = 1 / m * np.sum(A - Y)
    assert (dw.shape == w.shape)
    assert (db.dtype == float)
    cost = np.squeeze(cost)
    assert (cost.shape == ())
    grads = {"dw": dw,
             "db": db}
    return grads, cost
w, b, X, Y = np.array([[1], [2]]), 2, np.array([[1, 2], [3, 4]]), np.array([[1, 0]])
grads, cost = propagate(w, b, X, Y)
print("dw=" + str(grads["dw"]))
print("db=" + str(grads["db"]))
print("cost=" + str(cost))
9.优化函数
def optimize(w, b, X, Y, num_iterations, learning_rate, print_cost=False):
    costs = []
    for i in range(num_iterations):
        # num_iterations为优化循环的迭代次数
        grads, cost = propagate(w, b, X, Y)
        dw = grads["dw"]
        db = grads["db"]
        # 更新规则
        w = w - learning_rate * dw
        b = b - learning_rate * db
        if i % 100 == 0:
            costs.append(cost)
        # 输出训练结果次数为100 的训练例子
        if print_cost and i % 100 == 0:
            print("Cost after iteration %i:%f" % (i, cost))
            # 字典
    params = {"w": w,
              "b": b}
    grads = {"dw": dw,
             "db": db}
    return params, grads, costs


params, grads, costs = optimize(w, b, X, Y, num_iterations=100, learning_rate=0.09, print_cost=False)
print("w=" + str(params["w"]))
print("b=" + str(params["b"]))
print("dw=" + str(grads["dw"]))
print("db=" + str(grads["db"]))
10, 预测数据集
def predict(w, b, X):
    m = X.shape[1]
    Y_prediction = np.zeros((1, m))
    w = w.reshape(X.shape[0], 1)
    A = sigmoid(np.dot(w.T, X) + b)
    for i in range(A.shape[1]):
        if A[0, i] <= 0.5:
            Y_prediction[0, i] = 0
        else:
            Y_prediction[0, i] = 1
    assert (Y_prediction.shape == (1, m))
    return Y_prediction


print("predictions=" + str(predict(w, b, X))) ![]()
11,将所有功能合并到一块中
def model(X_train, Y_train, X_test, Y_test, num_iterations=2000, learning_rate=0.5, print_cost=False):
    w, b = initialize_with_zeros(X_train.shape[0])
    parameters, grads, costs = optimize(w, b, X_train, Y_train, num_iterations, learning_rate, print_cost)
    w = parameters["w"]
    b = parameters["b"]
    Y_prediction_test = predict(w, b, X_test)
    Y_prediction_train = predict(w, b, X_train)
    print("train accuracy:{}%".format(100 - np.mean(np.abs(Y_prediction_train - Y_train)) * 100))
    print("test accuracy:{}%".format(100 - np.mean(np.abs(Y_prediction_test - Y_test)) * 100))
    d = {"costs": costs,
         "Y_prediction_test": Y_prediction_test,
         "Y_prediction_train": Y_prediction_train,
         "w": w,
         "b": b,
         "learning_rate": learning_rate,
         "num_iterations": num_iterations}

    return d


d = model(train_set_x, train_set_y, test_set_x, test_set_y, num_iterations=2000, learning_rate=0.005, print_cost=True)
index = 1
plt.imshow(test_set_x[:, index].reshape((num_px, num_px, 3)))
pylab.show()
print("y=" + str(test_set_y[0, index]) + "you predicted that it is a\"" + classes[
int(d["Y_prediction_test"][0, index])].decode("utf-8") + "\"picture.")![]()
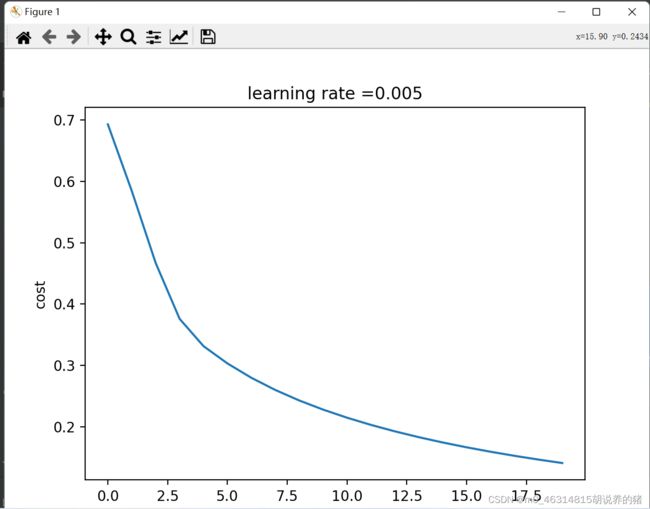
12,绘制损失函数和梯度
costs = np.squeeze(d['costs'])
plt.plot(costs)
plt.ylabel('cost')
plt.xlabel('iteration(per hundreds)')
plt.title("learning rate =" + str(d["learning_rate"]))
plt.show()
pylab.show()
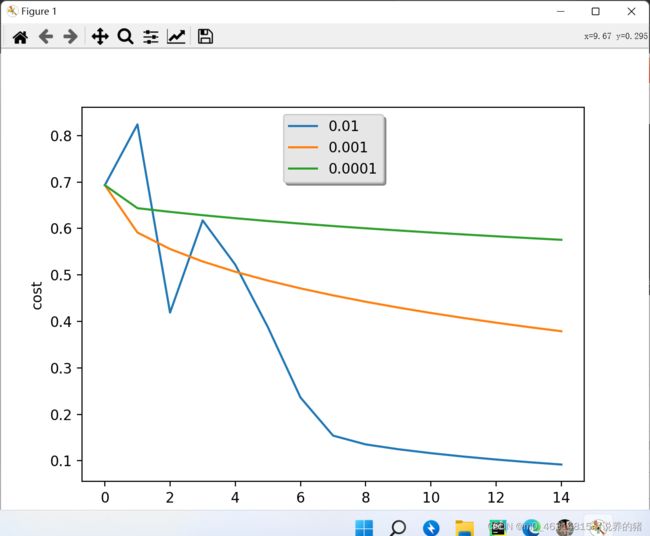
13,学习率的选择
learning_rates=[0.01,0.001,0.0001]
models={}
for i in learning_rates :
    print("learning rate is:"+str(i))
    models[str(i)]=model(train_set_x ,train_set_y ,test_set_x ,test_set_y ,num_iterations=1500,learning_rate=i,print_cost=False )
    print('\n'+"-----------------------------------------")
for i in learning_rates :
    plt.plot(np.squeeze(models[str(i)]["costs"]),label=str(models[str(i)]["learning_rate"]))
plt.ylabel('cost')
plt.xlabel('iterations')
legend=plt.legend(loc='upper center',shadow=True)
frame=legend.get_frame()
frame.set_facecolor('0.90')
plt.show()
pylab.show()


