【笔记】【机器学习基础】非负矩阵分解
非负矩阵分解
非负矩阵分解(NMF)是一种无监督学习算法,目的在于提取有用的特征,工作原理类似于PCA,可以识别出组合成数据的原始分量,也可以用于降维,通常不用于对数据进行重建或者编码。
1、将NMF应用于模拟数据
应用NMF时,我们必须保证数据是正的
两个分量的非负矩阵分解和一个分量的非负矩阵分解找到的分量
mglearn.plots.plot_nmf_illustration()

在NMF中,不存在“第一非负分量”,所有分量地位平等,减少分量个数会删除一些方向。NMF使用了随机初始化,根据随机种子的不同可能会产生不同的结果。
2、将NMF应用于人脸图像
NMF的主要参数:想要提取的分量个数。
通常这个数字要小于输入特征的个数(否则将每个像素作为单独的分量就可以解释数据)。
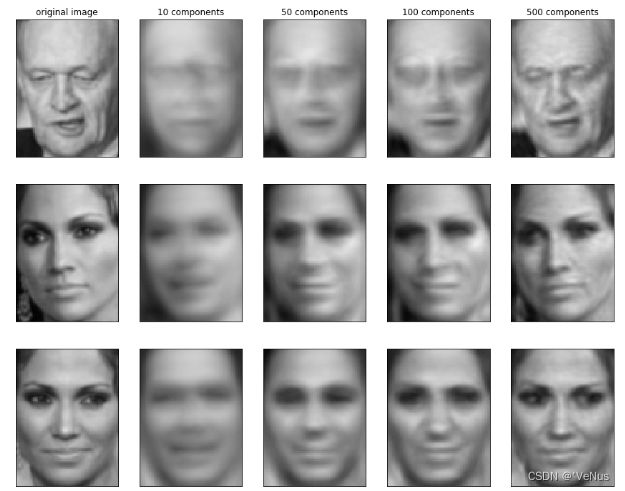
观察分量个数如何影响NMF重建数据的好坏
(1)利用越来越多分量的NMF重建三张人脸图像
mglearn.plots.plot_nmf_faces(X_train, X_test, image_shape)
from sklearn.decomposition import NMF
nmf = NMF(n_components=15, random_state=0)
nmf.fit(X_train)
X_train_nmf = nmf.transform(X_train)
X_test_nmf = nmf.transform(X_test)

fig, axes = plt.subplots(3, 5, figsize=(15, 12),
                         subplot_kw={'xticks': (), 'yticks': ()})
for i, (component, ax) in enumerate(zip(nmf.components_, axes.ravel())):
    ax.imshow(component.reshape(image_shape))
    ax.set_title("{}. component".format(i))
(3)查看分量较大的图像
compn = 3

inds = np.argsort(X_train_nmf[:, compn])[::-1]
fig, axes = plt.subplots(2, 5, figsize=(15, 8),
                         subplot_kw={'xticks': (), 'yticks': ()})
fig.suptitle("Large component 3")
for i, (ind, ax) in enumerate(zip(inds, axes.ravel())):
    ax.imshow(X_train[ind].reshape(image_shape))

compn = 7

inds = np.argsort(X_train_nmf[:, compn])[::-1]
fig.suptitle("Large component 7")
fig, axes = plt.subplots(2, 5, figsize=(15, 8),
                         subplot_kw={'xticks': (), 'yticks': ()})
for i, (ind, ax) in enumerate(zip(inds, axes.ravel())):
    ax.imshow(X_train[ind].reshape(image_shape))
根据图可知,分量较大的都是向右看或者向左看的人脸
所以提取这样的模式适合于具有叠加结构的数据包括音频、基因表达、文本数据
举例:
假设对一个信号感兴趣,是有三个不同的信号源组成的
S = mglearn.datasets.make_signals()
plt.figure(figsize=(6, 1))
plt.plot(S, '-')
plt.xlabel("Time")
plt.ylabel("Signal")

但无法观测到原始信号,这能观测到叠加混合的,需要将信号分解成原始分量。
A = np.random.RandomState(0).uniform(size=(100, 3))
X = np.dot(S, A.T)
print("Shape of measurements: {}".format(X.shape))
使用NMF还原信号:
nmf = NMF(n_components=3, random_state=42)
S_ = nmf.fit_transform(X)
print("Recovered signal shape: {}".format(S_.shape))
使用PCA进行对比:
pca = PCA(n_components=3)
H = pca.fit_transform(X)
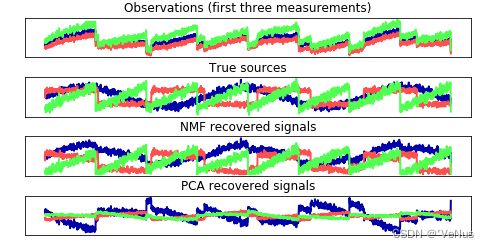
图中显示NMF和PCA发现的信号波动
models = [X, S, S_, H]
names = ['Observations (first three measurements)',
         'True sources',
         'NMF recovered signals',
         'PCA recovered signals']

fig, axes = plt.subplots(4, figsize=(8, 4), gridspec_kw={'hspace': .5},
                         subplot_kw={'xticks': (), 'yticks': ()})

for model, name, ax in zip(models, names, axes):
    ax.set_title(name)
    ax.plot(model[:, :3], '-')

NMF在发现原始信号源时得到了不错的结果,而PCA失败了(仅使用第一个成分解释数据变化)
NMF生成的分量是没有顺序的,例子中分量顺序和原始信号完全相同(线的颜色)只是偶然
