Python Matplotlib Rugular Function
仅供个人参考
参考网站:w3schools_matplotlib
导入
import matplotlib.pyplot as plt
Markers
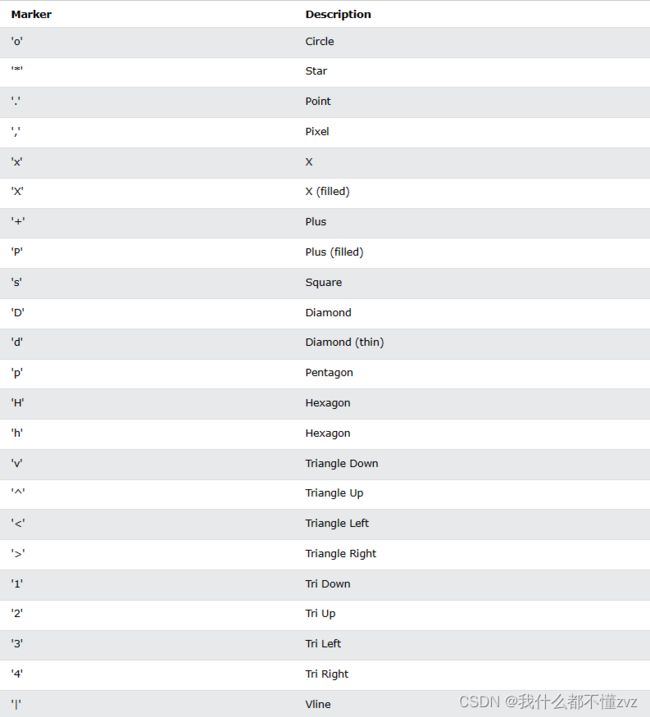
markers:
Markers就是(x,y)点处的标记
plt.plot(x,y,marker='o') 或 plt.plot(x,y,m='o')
markersize 或 ms:
标记大小
plt.plot(x,y,m='o',ms=20)
markeredgecolor或mec:
标记边缘颜色
plt.plot(x,y,m='o',mec='green')
markerfacecolor或mfc:
标记内部颜色
plt.plot(x,y,m='o',mfc='green')
color
线的颜色
plt.plot(x,y,color='green')或plt.plot(x,y,c='green')
Line
linestyle或ls:
plt.plot(ypoints, linestyle = 'dotted')
linewidth或lw:
plt.plot(ypoints, linewidth = '20.5')
多条线:
plt.plot(x1, y1, x2, y2)
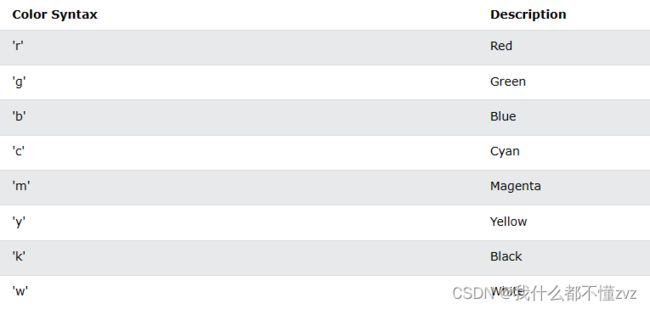
可以直接连着使用,marker|line|color,比如
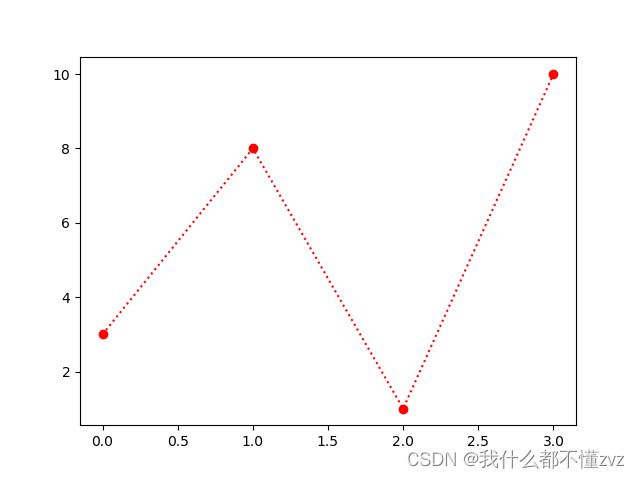
plt.plot(ypoints, 'o:r')
Label
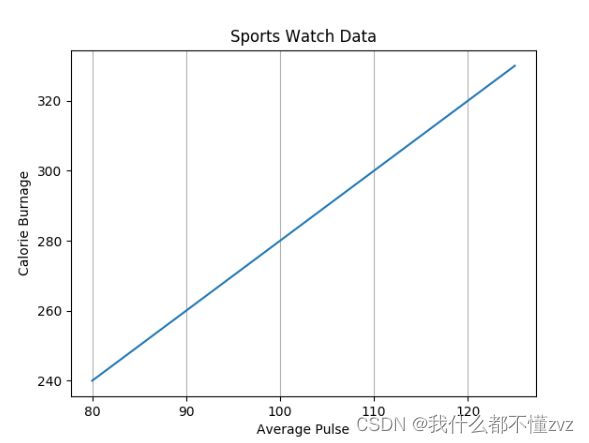
x和y轴的label以及title:
plt.xlabel("Average Pulse")
plt.ylabel("Calorie Burnage")
plt.title("Sports Watch Data")
fontdict:
改变label字体大小颜色等
font1 = {'family':'serif','color':'blue','size':20}
font2 = {'family':'serif','color':'darkred','size':15}

plt.title("Sports Watch Data", fontdict = font1)
plt.xlabel("Average Pulse", fontdict = font2)
plt.ylabel("Calorie Burnage", fontdict = font2)

loc:
参数为left、right、center(default)
plt.title("Sports Watch Data", loc = 'left')
Grid
十字格子:
plt.grid()
竖着的格子:
plt.grid(axis = 'x')
格式样式:
plt.grid(color = 'green', linestyle = '--', linewidth = 0.5)
Subplot
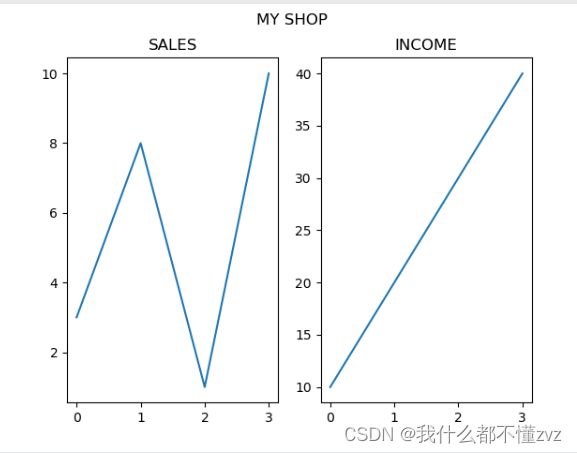
可以在每个subplot下单独操作
plt.subplot(row,col,number)
Scatter
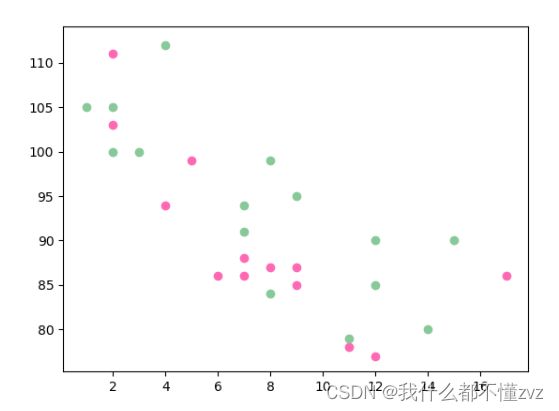
散点图
x = np.array([5,7,8,7,2,17,2,9,4,11,12,9,6])
y = np.array([99,86,87,88,111,86,103,87,94,78,77,85,86])
plt.scatter(x, y, color = 'hotpink')

x = np.array([2,2,8,1,15,8,12,9,7,3,11,4,7,14,12])
y = np.array([100,105,84,105,90,99,90,95,94,100,79,112,91,80,85])
plt.scatter(x, y, color = '#88c999')
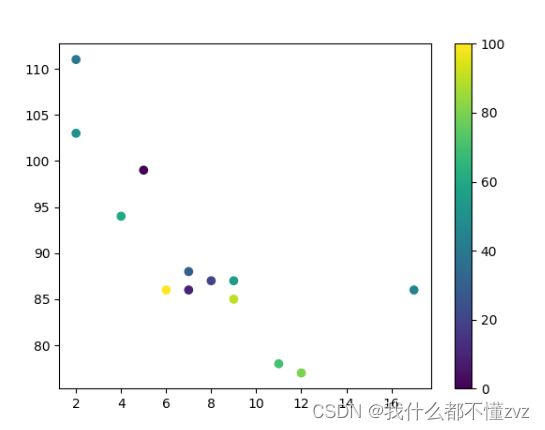
colormap:
colormap有很多种,自行查看(参考链接)
x = np.array([5,7,8,7,2,17,2,9,4,11,12,9,6])
y = np.array([99,86,87,88,111,86,103,87,94,78,77,85,86])
colors = np.array([0, 10, 20, 30, 40, 45, 50, 55, 60, 70, 80, 90, 100])

plt.scatter(x, y, c=colors, cmap='viridis') # cmap='viridis'使用colormap

plt.colorbar() # 显示colorbar
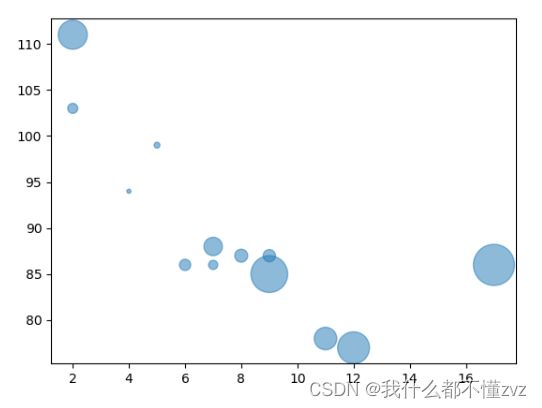
size:
plt.scatter(x, y, s=[100,200,300,80])
alpha:
透明度
plt.scatter(x, y, s=sizes, alpha=0.5)
Bar
柱状图
plt.bar(x, y)
转置柱状图:
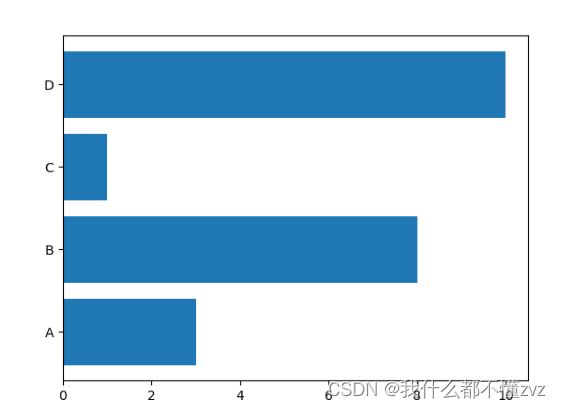
plt.barh(x, y)
plt.barh(x, y, height = 0.1)
histograms
plt.hist(x)
Pie chart
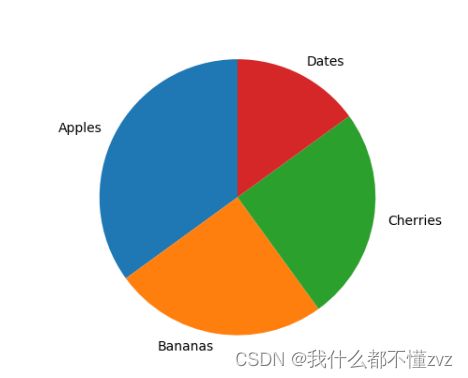
plt.pie(y, labels = mylabels, startangle = 90)
legend
解释每个组件的列表
plt.legend()
plt.legend(title = "Four Fruits:")
