python绘制中国降雨分布(添加等高线、比例尺、指南针、南海诸岛、九段线)
python绘制中国降雨分布(添加等高线、比例尺、指南针、南海诸岛、九段线)
准备工作
1.降雨数据,每小时,每站点
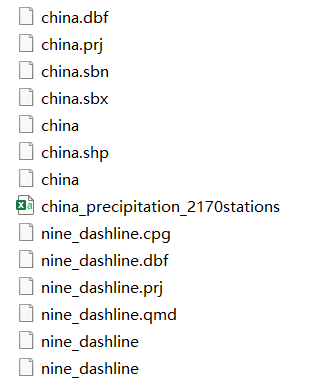
2.中国、九段线和站点经纬度
txt降雨数据处理
import pandas as pd
import os
dir = 'D:/OneDrive/UCAS/courses/python2/final1/data'
txtLists = os.listdir(dir)
files = list(filter(lambda x: x[-4:] in ['.txt'], txtLists))
df = pd.DataFrame()
for file in files:
    data = pd.read_table(dir+'/'+file, sep=' ', index_col=False)
    df = pd.concat([df, data], axis=0)
df = df[['Station_Id_C', 'Year', 'Mon', 'Day', 'Hour', 'PRE_1h']] #df.iloc[:, [0, 1, 2, 3, 21]]
df[df['PRE_1h'] > 1000] = 0 #df.to_csv('pre.csv')
降雨数据连接站点
g = df[["Station_Id_C", 'PRE_1h']].groupby(["Station_Id_C"]).sum()
filename = 'D:/OneDrive/UCAS/courses/python2/final1/china_precipitation_2170stations.csv'
site = pd.read_csv(filename,encoding='GBK')
c = pd.merge(g, site,  left_on='Station_Id_C', right_on='区站号')
定义指南针和比例尺函数
import matplotlib.patches as mpatches
def add_north(ax, labelsize=18, loc_x=0.08, loc_y=0.95, width=0.06, height=0.09, pad=0.14):
    """
    画一个比例尺带'N'文字注释
    主要参数如下
    :param ax: 要画的坐标区域 Axes实例 plt.gca()获取即可
    :param labelsize: 显示'N'文字的大小
    :param loc_x: 以文字下部为中心的占整个ax横向比例
    :param loc_y: 以文字下部为中心的占整个ax纵向比例
    :param width: 指南针占ax比例宽度
    :param height: 指南针占ax比例高度
    :param pad: 文字符号占ax比例间隙
    :return: None
    """
    minx, maxx = ax.get_xlim()
    miny, maxy = ax.get_ylim()
    ylen = maxy - miny
    xlen = maxx - minx
    left = [minx + xlen*(loc_x - width*.5), miny + ylen*(loc_y - pad)]
    right = [minx + xlen*(loc_x + width*.5), miny + ylen*(loc_y - pad)]
    top = [minx + xlen*loc_x, miny + ylen*(loc_y - pad + height)]
    center = [minx + xlen*loc_x, left[1] + (top[1] - left[1])*.4]
    triangle = mpatches.Polygon([left, top, right, center], color='k')
    ax.text(s='N',
            x=minx + xlen*loc_x,
            y=miny + ylen*(loc_y - pad + height),
            fontsize=labelsize,
            horizontalalignment='center',
            verticalalignment='bottom')
    ax.add_patch(triangle)

#-----------函数:添加比例尺--------------
def add_scalebar(ax,lon0,lat0,length,size=0.45):
    '''
    ax: 坐标轴
    lon0: 经度
    lat0: 纬度
    length: 长度
    size: 控制粗细和距离的
    '''
    # style 3
    ax.hlines(y=lat0,  xmin = lon0, xmax = lon0+length/111, colors="black", ls="-", lw=1, label='%d km' % (length))
    ax.vlines(x = lon0, ymin = lat0-size, ymax = lat0+size, colors="black", ls="-", lw=1)
    ax.vlines(x = lon0+length/2/111, ymin = lat0-size, ymax = lat0+size, colors="black", ls="-", lw=1)
    ax.vlines(x = lon0+length/111, ymin = lat0-size, ymax = lat0+size, colors="black", ls="-", lw=1)
    ax.text(lon0+length/111,lat0+size+0.05,'%d' % (length),horizontalalignment = 'center')
    ax.text(lon0+length/2/111,lat0+size+0.05,'%d' % (length/2),horizontalalignment = 'center')
    ax.text(lon0,lat0+size+0.05,'0',horizontalalignment = 'center')
    ax.text(lon0+length/111/2*3,lat0+size+0.05,'km',horizontalalignment = 'center')

    # style 1
    # print(help(ax.vlines))
    # ax.hlines(y=lat0,  xmin = lon0, xmax = lon0+length/111, colors="black", ls="-", lw=2, label='%d km' % (length))
    # ax.vlines(x = lon0, ymin = lat0-size, ymax = lat0+size, colors="black", ls="-", lw=2)
    # ax.vlines(x = lon0+length/111, ymin = lat0-size, ymax = lat0+size, colors="black", ls="-", lw=2)
    # # ax.text(lon0+length/2/111,lat0+size,'500 km',horizontalalignment = 'center')
    # ax.text(lon0+length/2/111,lat0+size,'%d' % (length/2),horizontalalignment = 'center')
    # ax.text(lon0,lat0+size,'0',horizontalalignment = 'center')
    # ax.text(lon0+length/111/2*3,lat0+size,'km',horizontalalignment = 'center')

    # style 2
    # plt.hlines(y=lat0,  xmin = lon0, xmax = lon0+length/111, colors="black", ls="-", lw=1, label='%d km' % (length))
    # plt.vlines(x = lon0, ymin = lat0-size, ymax = lat0+size, colors="black", ls="-", lw=1)
    # plt.vlines(x = lon0+length/111, ymin = lat0-size, ymax = lat0+size, colors="black", ls="-", lw=1)
    # plt.text(lon0+length/111,lat0+size,'%d km' % (length),horizontalalignment = 'center')
    # plt.text(lon0,lat0+size,'0',horizontalalignment = 'center')
#原始代码中包含了三种样式的图例,样子都还不错。
#ax:是我们创建的子图
#lon,lat:是我们图例想要放在那个位置的坐标,根据个人喜好来!!!
#length:是我们比例的你所输入的比例,比如200等
#size:是控制比例尺的高度的(比例尺上三根竖线的高度,一会下面会有展示的)
数据处理和空间插值
import geopandas
import numpy as np
import math
from rasterio.transform import Affine
from rasterio import features
from scipy import interpolate
import matplotlib.pyplot as plt
import rioxarray
import xarray
filename = 'D:/OneDrive/UCAS/courses/python2/final1/china.shp'
china_boundary = geopandas.read_file(r"D:\OneDrive\data\dashline.shp")

china = geopandas.read_file(filename)
#bbox
minx = china.bounds['minx'].min()
miny = china_boundary.bounds['miny'].min()
maxx = china.bounds['maxx'].max()
maxy = china.bounds['maxy'].max()
#gridding - mask
delta = 0.5
row = math.ceil((maxy-miny)/delta)
col = math.ceil((maxx-minx)/delta)
transform = Affine.from_gdal(minx,delta,0,miny,0,delta)
china['region']=1
polys = ((geom,value) for geom, value in zip(china.geometry, china['region']))
mask = features.rasterize(shapes=polys, out_shape=(row,col), fill=0, transform=transform)
#filename = 'D:/OneDrive/UCAS/courses/python2/midterm-assignment-20221017/china_precipitation_2170stations.csv'
#df = pandas.read_csv(filename,encoding='GBK')
gdf = geopandas.GeoDataFrame(c, geometry=geopandas.points_from_xy(c["X"], c["Y"]))
gdf = gdf.query('70)
#rbf
x_ = np.arange(minx+delta/2,minx+col*delta,delta)
y_ = np.arange(miny+delta/2,miny+row*delta,delta)
X,Y = np.meshgrid(x_,y_)
rbf = interpolate.Rbf(gdf['X'],gdf['Y'], gdf['降雨量'], function = "thin_plate")
Z = rbf(X, Y)

#masking non-mainland area
prec = Z*1.0
prec[np.where(mask==0)] = np.nan
prec[np.where(prec<=0)] = np.nan
da_prec = xarray.DataArray(data=prec,dims=['y','x'],coords=dict(x=(['x'],x_),y=(['y'],y_)))
xr = da_prec.to_dataset(name='prec')
da_mask = xarray.DataArray(data=mask,dims=['y','x'],coords=dict(x=(['x'],x_),y=(['y'],y_)))
xr['mask'] = da_mask
绘图
### Basemap based plotting
#import matplotlib as mpl
#mpl.use('Qt5Agg')
#%matplotlib auto
from mpl_toolkits.basemap import Basemap, cm
import matplotlib.patches as mpatches

ax=plt.gca()

#basemap
m = Basemap(llcrnrlat=miny,urcrnrlat=maxy,llcrnrlon=minx,urcrnrlon=maxx,\
    ellps='WGS84',epsg=4326,resolution='l',ax=ax)
m.drawmeridians(np.arange(80,135,10),labels=[0,0,0,1],fontsize=10,linewidth=2)
m.drawparallels(np.arange(0,60,10),labels=[1,0,0,0],fontsize=10)

#contourf by basemap
clevs = [v for v in range(0,50,1)]+[v for v in range(50,800,50)]+[800,5000]
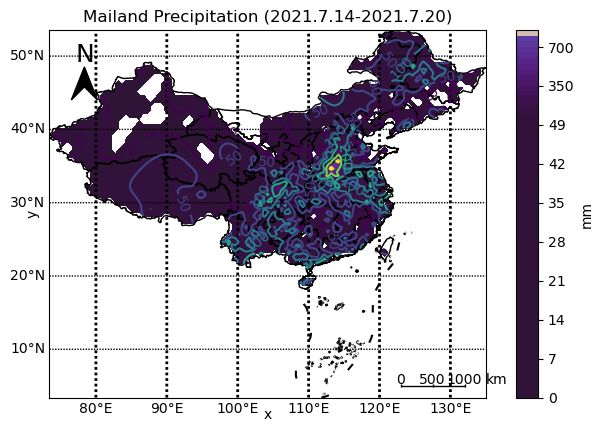
cs = m.contourf(X,Y,prec,clevs,cmap='twilight_shifted')
cbar = m.colorbar(cs,location='right',pad="5%")
cbar.set_label('mm')

#china mainland boundary, label
china.plot(ax=ax,linewidth=1,facecolor="none")
china_boundary.plot(ax=ax,linewidth=1.5,facecolor="none", color='black')


#geopandas - dataframe
levels = [10,50,100,200,400,800]
add_scalebar(ax,123,5,1000,size=0.2) # 添加比例尺
add_north(ax)

cs = xr['prec'].plot.contour(ax=ax,levels=levels)
plt.clabel(cs, inline=True, fmt='%d', fontsize=10)
plt.title('Mailand Precipitation (2021.7.14-2021.7.20)')
plt.show()
参考资料:
[1] 中国科学院大学课程:python空间数据处理(芮小平、宋现锋)
[2] 【python】使用python绘制地图时添加指北针 https://blog.csdn.net/qq_32832803/article/details/110910540
[3] Python与开源GIS:数据处理、空间分析与地图制图:https://www.osgeo.cn/pygis/index.html#


