python画图坐标yscale取对数后显示不全
python画图yscale取对数后只显示部分点
记录ttpf
ax1=fig.add_subplot(231)
x=plotss[31]
y=plotss[202]
#ym=np.min(y)
#yx=np.max(y)
#plot1=ax1.scatter(x,y,marker='D',s=2,color='r',edgecolor=None)
ax1.semilogy(x,y,'D',color='r')
#ax1.set_yscale('log')
plt.grid(True)
ax1.set_xlabel(r'$scatter$',fontsize=10)
ax1.set_ylabel(r'$x_axis$',fontsize=10)
#plt.ylim(ym,yx)
plotss是我自己本地文件读取后定义的变量。

上面代码跑出来的图片很正常, 但是matplotlib中的semilog函数是在对数坐标下画图,而且若是要在图片中插入colorbar,或者改变点的形态等。这样semilog画图就不是很灵活了。
于是改成使用scale来改变坐标刻度。
ax1=fig.add_subplot(231)
x=plotss[31]
y=plotss[202]
ym=np.min(y)
yx=np.max(y)
plot1=ax1.scatter(x,y,marker='D',s=2,color='r',edgecolor=None)
# ax1.semilogy(x,y,'D',color='r')
ax1.set_yscale('log')
plt.grid(True)
ax1.set_xlabel(r'$x-axis$',fontsize=10)
ax1.set_ylabel(r'$scatter$',fontsize=10)
# plt.ylim(ym,yx)
 发现图片中之画出了极少的点,大部分点在下方,图中没有显示出来。
在代码中加入限制,使用ylim改变纵坐标的范围为ymin和ymax,能把全部点画出
ax1=fig.add_subplot(231)
x=plotss[31]
y=plotss[202]
ym=np.min(y)
yx=np.max(y)
plot1=ax1.scatter(x,y,marker='D',s=2,color='r',edgecolor=None)
# ax1.semilogy(x,y,'D',color='r')
ax1.set_yscale('log')
plt.grid(True)
ax1.set_xlabel(r'$x-axis$',fontsize=10)
ax1.set_ylabel(r'$scatter$',fontsize=10)
plt.ylim(ym,yx)
 但是这样的话每次画图前得去找到纵坐标的极大值极小值,也不是很灵活。
yscale应该能做到semilog类似的效果。
百思不得其解,偶然找到原因。
甚至在matplotlib官方资料里,set_yscale都是放在plt.scatter后面的,类似于解释先画图再把坐标刻度换成对数坐标。但是这样会出问题(不知道原因)
放在前面后,画图正常了
类似于在对数坐标里画图的效果?
ax1=fig.add_subplot(231)
x=plotss[31]
y=plotss[202]
# ym=np.min(y)
# yx=np.max(y)
ax1.set_yscale('log')
plot1=ax1.scatter(x,y,marker='D',s=2,color='r',edgecolor=None)
# ax1.semilogy(x,y,'D',color='r')
plt.grid(True)
ax1.set_xlabel(r'$x-axis$',fontsize=10)
ax1.set_ylabel(r'$scatter$',fontsize=10)
# plt.ylim(ym,yx)
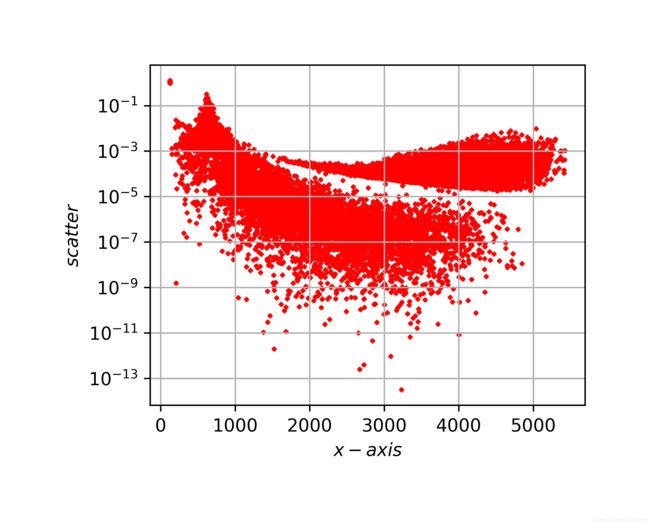 正常。
正常。
附上scale的properties(set_yscale的参数):
| Properties | Description | Available scale |
|---|---|---|
| basex/basey | the base of the logarithm | log,symlog |
| subsx/subsy | Where to place the subticks between each major tick. Should be a sequence of integers | log,symlog |
| nonposx/nonposy | [‘mask’ / ‘clip’ ]; non-positive values in x or y can be masked as invalid, or clipped to a very small positive number. | log |
| linthreshx/linthreshy | The range (-x, x) within which the plot is linear (to avoid having the plot go to infinity around zero) | symlog |
| linscalex/linscaley | This allows the linear range (-linthresh to linthresh) to be stretched relative to the logarithmic range. Its value is the number of decades to use for each half of the linear range. | symlog |