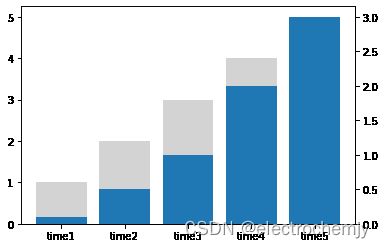
双坐标柱状图
import matplotlib.pyplot as plt
x=['time1','time2','time3','time4','time5']
y1=[1,2,3,4,5]
y2=[0.1,0.5,1,2,3]
fig=plt.figure()
ax1 = fig.add_subplot(111)
ax1.bar(x,y1,color='lightgray')
ax2 = ax1.twinx()
ax2.bar(x,y2)
图形美化
import matplotlib.pyplot as plt
x=['time1','time2','time3','time4','time5']
y1=[1,2,3,4,5]
y2=[0.1,0.5,1,2,3]
fig=plt.figure(dpi=300)
font1 = {'family' : 'Arial',
'weight' : 'normal',
'size' : 16,
}
ax1 = fig.add_subplot(111)
ax1.bar(x,y1,label='y1',color='lightgray')
plt.legend(frameon=False,fontsize='large',bbox_to_anchor=(0.5, 1.02), loc=3, borderaxespad=0)
plt.xlabel('time',font1)
plt.ylabel('test',font1)
plt.xticks(rotation=90,fontsize=12)
plt.yticks(fontsize=12)
ax2 = ax1.twinx()
ax2.bar(x,y2,label='y2',color='tab:pink')
plt.legend(frameon=False,fontsize='large',bbox_to_anchor=(0.02, 1.02), loc=3, borderaxespad=0)
plt.xlabel('time',font1)
plt.ylabel('y2',font1)
plt.xticks(rotation=90,fontsize=12)
plt.yticks(fontsize=12)

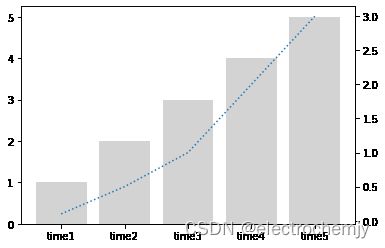
双坐标柱线图
x=['time1','time2','time3','time4','time5']
y1=[1,2,3,4,5]
y2=[0.1,0.5,1,2,3]
fig=plt.figure()
ax1 = fig.add_subplot(111)
ax1.bar(x,y1,color='lightgray')
ax2 = ax1.twinx()
ax2.plot(x,y2,linestyle='dotted',color='tab:blue')
图形美化
x=['time1','time2','time3','time4','time5']
y1=[1,2,3,4,5]
y2=[0.1,0.5,1,2,3]
fig=plt.figure(dpi=300)
font1 = {'family' : 'Arial',
         'weight' : 'normal',
         'size'   : 16,
         }
ax1 = fig.add_subplot(111)
ax1.bar(x,y1,label='y1',color='lightgray')
plt.legend(frameon=False,fontsize='large',bbox_to_anchor=(0.5, 1.02), loc=3, borderaxespad=0)
plt.xlabel('time',font1)
plt.ylabel('y1',font1)
plt.xticks(rotation=90,fontsize=12)
plt.yticks(fontsize=12)
ax2 = ax1.twinx()
ax2.plot(x,y2,linestyle='dotted',label='y2',color='tab:blue')
plt.legend(frameon=False,fontsize='large',bbox_to_anchor=(0.02, 1.02), loc=3, borderaxespad=0)
plt.xlabel('time',font1)
plt.ylabel('y2',font1)
plt.xticks(rotation=90,fontsize=12)
plt.yticks(fontsize=12)
