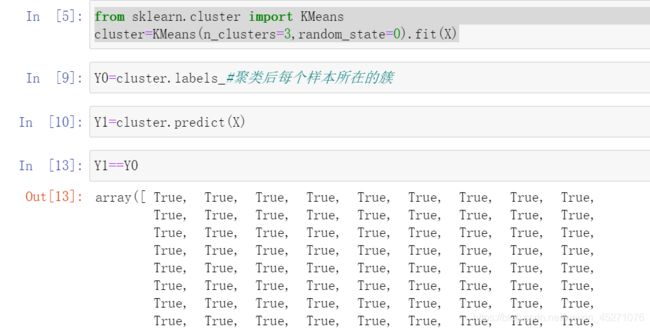


from sklearn.cluster import KMeans
cluster=KMeans(n_clusters=3,random_state=0).fit(X)
y_pred=cluster.labels_
color=["red","pink","orange","gray"]
#根据聚类结果画图
fig,ax1=plt.subplots(1)
for i in range(3):
    ax1.scatter(X[y_pred==i,0],X[y_pred==i,1]
               ,marker='o'
               ,s=8,
               c=color[i])

ax1.scatter(cluster.cluster_centers_[:,0],cluster.cluster_centers_[:,1]
           ,marker="x"
           ,s=20,
            c="black"
        )
plt.show()




#聚类算法的模型评估指标
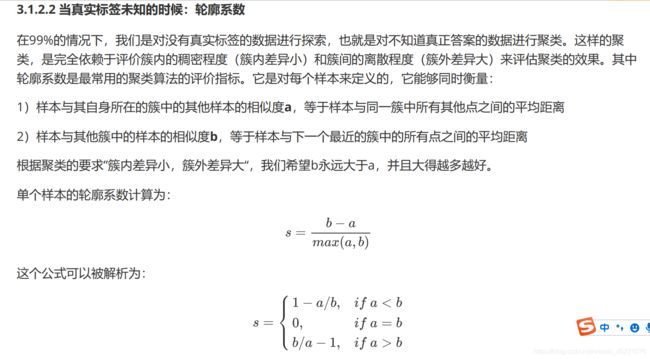
#轮廓系数是对每一个样本而言的,不是针对某一簇而言
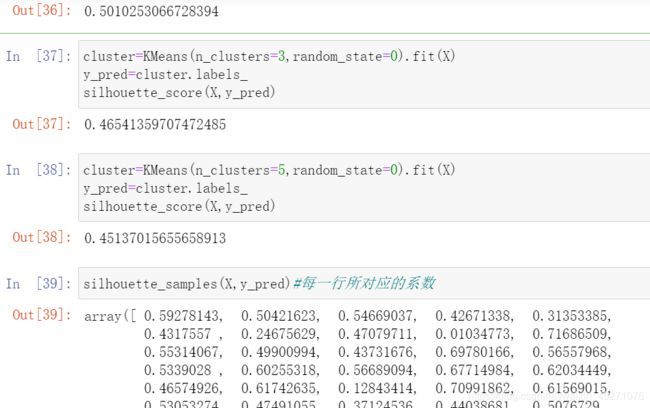
from sklearn.metrics import silhouette_samples
from sklearn.metrics import silhouette_score
cluster=KMeans(n_clusters=4,random_state=0).fit(X)
y_pred=cluster.labels_
silhouette_score(X,y_pred)

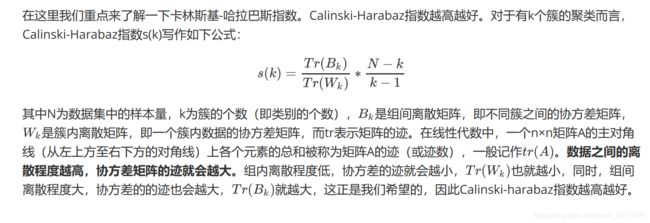


#通过轮廓系数来选择最佳的n_clusters,之所以不选择学习曲线是因为它不能很好的展示分类结果
#sklearn中的kmeans使用的是欧式距离
from sklearn.datasets import make_blobs
import matplotlib.pyplot as plt
import numpy as np
import matplotlib.cm as cm#colormap用来画图
#自己创建数据集
X,y=make_blobs(n_samples=500,n_features=2,centers=4,random_state=0)
n_clusters=4
#创建一个画布,画布上有2个子图对象
fig,(ax1,ax2)=plt.subplots(1,2)
#设置画布的尺寸
fig.set_size_inches(18,7)
#第一个图是轮廓系数图像,由每个样本的轮廓系数作为横坐标
#横向条形图,纵坐标是每个样本,并且要求同一簇内的放在一起,同样的颜色,
ax1.set_xlim([-0.1,1])
ax1.set_ylim([0,X.shape[0]+(n_clusters+1)*10])
#开始建模
clusterer=KMeans(n_clusters=n_clusters,random_state=10).fit(X)
silhouette_avg=silhouette_score(X,clusterer.labels_)#整体的轮廓系数
print("FOR n_clusters=",n_clusters,"the average silhouette_score is ",silhouette_avg)
#返回每个样本的轮廓系数作为横坐标,并且把横坐标进行排序
sample_silhouette_values=silhouette_samples(X,clusterer.labels_)
#设定y轴上的初始取值
y_lower=10
#接下来对每一个簇进行循环
for i in range(n_clusters):
    ith_cluster_silhouette_values=sample_silhouette_values[clusterer.labels_==i]
    ith_cluster_silhouette_values.sort()
    #得出该簇中的样本总数
    size_cluster_i=ith_cluster_silhouette_values.shape[0]
    #这一簇的纵坐标就是y_lower+样本总数
    y_upper=y_lower+size_cluster_i
    #colormap使用小数来调用颜色的函数
    #nipy_spectral(输入任意小数代表一个颜色)(i)
    color=cm.nipy_spectral(float(i)/n_clusters)
    #开始填充图像
    #fill_between是填充曲线与直角之间空间的函数
    #fill_betweenx的直角实在纵坐标上,定义曲线点的横坐标,纵坐标,颜色
    #fill_betweeny的直角实在横坐标上
    ax1.fill_betweenx(np.arange(y_lower,y_upper)
                     ,ith_cluster_silhouette_values
                     ,facecolor=color
                     ,alpha=0.7)
    ax1.text(-0.05,y_lower+0.5*size_cluster_i,str(i))
    y_lower=y_upper+10
ax1.set_title("The silhouette plot for the various clusters.")
ax1.set_xlabel("The silhouette coefficient values")
ax1.set_ylabel("Cluster label")
ax1.axvline(x=silhouette_avg, color="red", linestyle="--")#设置一条均线
ax1.set_yticks([])
ax1.set_xticks([-0.1, 0, 0.2, 0.4, 0.6, 0.8, 1])
colors = cm.nipy_spectral(clusterer.labels_.astype(float) / n_clusters)
ax2.scatter(X[:,0],X[:,1]
           ,c=colors,
           marker="o",
           s=8)
centers=clusterer.cluster_centers_
ax2.scatter(centers[:,0],centers[:,1]
           ,marker="x"
           ,s=15,
           c="black")
plt.show()
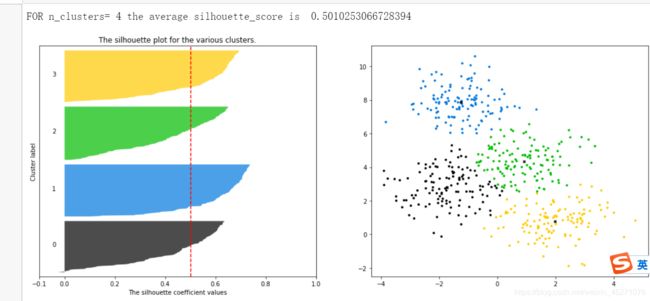
for n_clusters in [2,3,4,5,6,7]:
    #创建一个画布,画布上有2个子图对象
    fig,(ax1,ax2)=plt.subplots(1,2)
    #设置画布的尺寸
    fig.set_size_inches(18,7)
    #第一个图是轮廓系数图像,由每个样本的轮廓系数作为横坐标
    #横向条形图,纵坐标是每个样本,并且要求同一簇内的放在一起,同样的颜色,
    ax1.set_xlim([-0.1,1])
    ax1.set_ylim([0,X.shape[0]+(n_clusters+1)*10])
    #开始建模
    clusterer=KMeans(n_clusters=n_clusters,random_state=10).fit(X)
    silhouette_avg=silhouette_score(X,clusterer.labels_)#整体的轮廓系数
    print("FOR n_clusters=",n_clusters,"the average silhouette_score is ",silhouette_avg)
    #返回每个样本的轮廓系数作为横坐标,并且把横坐标进行排序
    sample_silhouette_values=silhouette_samples(X,clusterer.labels_)
    #设定y轴上的初始取值
    y_lower=10
    #接下来对每一个簇进行循环
    for i in range(n_clusters):
        ith_cluster_silhouette_values=sample_silhouette_values[clusterer.labels_==i]
        ith_cluster_silhouette_values.sort()
        #得出该簇中的样本总数
        size_cluster_i=ith_cluster_silhouette_values.shape[0]
        #这一簇的纵坐标就是y_lower+样本总数
        y_upper=y_lower+size_cluster_i
        #colormap使用小数来调用颜色的函数
        #nipy_spectral(输入任意小数代表一个颜色)(i)
        color=cm.nipy_spectral(float(i)/n_clusters)
        #开始填充图像
        #fill_between是填充曲线与直角之间空间的函数
        #fill_betweenx的直角实在纵坐标上,定义曲线点的横坐标,纵坐标,颜色
        #fill_betweeny的直角实在横坐标上
        ax1.fill_betweenx(np.arange(y_lower,y_upper)
                         ,ith_cluster_silhouette_values
                         ,facecolor=color
                         ,alpha=0.7)
        ax1.text(-0.05,y_lower+0.5*size_cluster_i,str(i))
        y_lower=y_upper+10
    ax1.set_title("The silhouette plot for the various clusters.")
    ax1.set_xlabel("The silhouette coefficient values")
    ax1.set_ylabel("Cluster label")
    ax1.axvline(x=silhouette_avg, color="red", linestyle="--")#设置一条均线
    ax1.set_yticks([])
    ax1.set_xticks([-0.1, 0, 0.2, 0.4, 0.6, 0.8, 1])
    colors = cm.nipy_spectral(clusterer.labels_.astype(float) / n_clusters)
    ax2.scatter(X[:,0],X[:,1]
               ,c=colors,
               marker="o",
               s=8)
    centers=clusterer.cluster_centers_
    ax2.scatter(centers[:,0],centers[:,1]
               ,marker="x"
               ,s=15,
               c="black")
    plt.show()

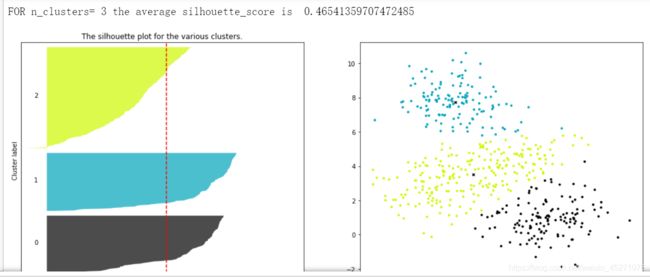
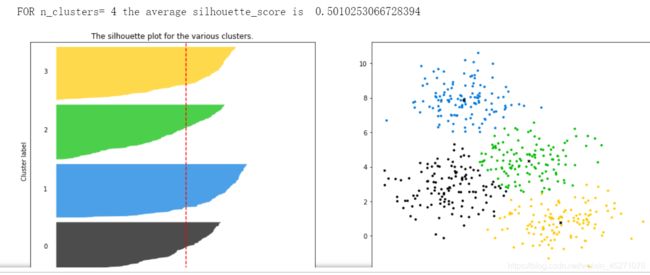


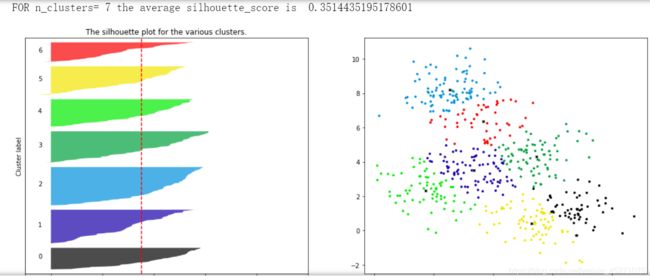
并不是选择轮廓系数最高的,而是根据业务需求进行选择
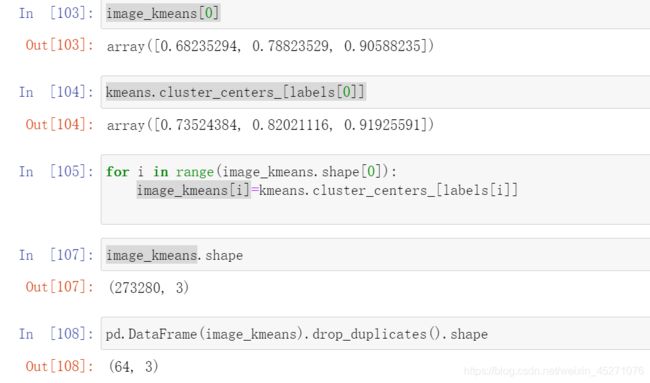
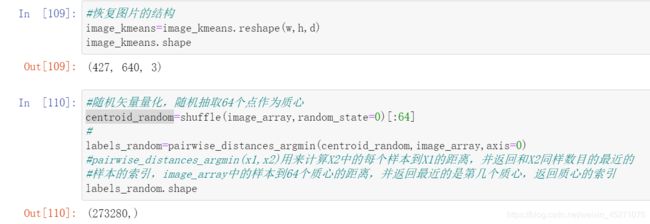
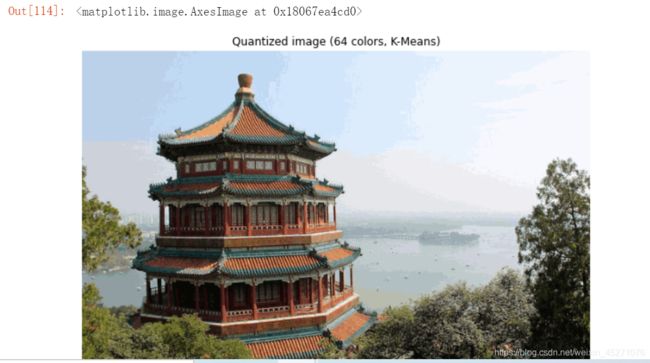
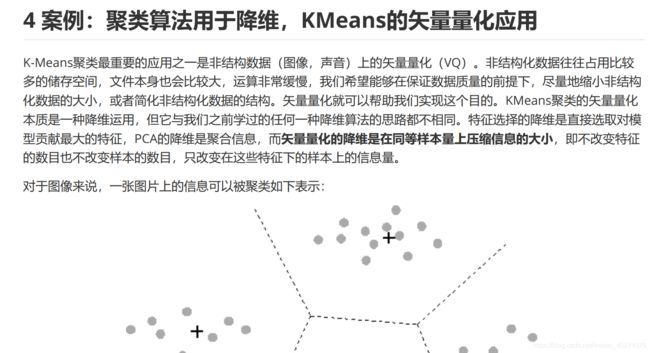
矢量量化


#使用kmeans做矢量量化
import numpy as np
import pandas as pd
import matplotlib.pyplot as plt
from sklearn.cluster import KMeans
from sklearn.metrics import pairwise_distances_argmin
#对两个序列中的点进行距离匹配的函数
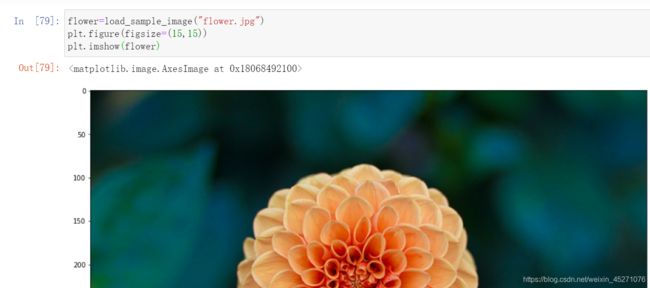
from sklearn.datasets import load_sample_image
#导入图片数据的类
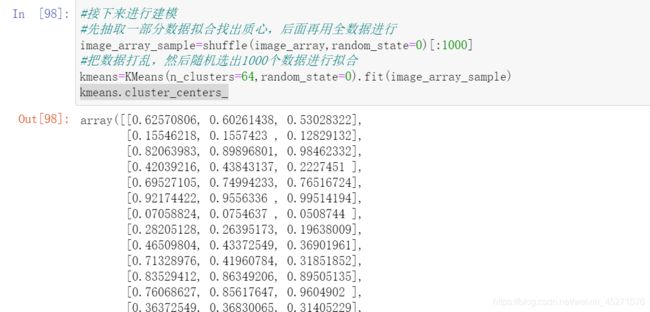
from sklearn.utils import shuffle
#打乱一个有序的序列,用来洗牌等
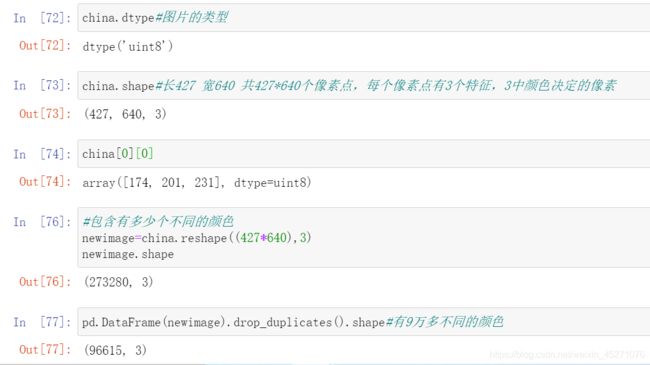
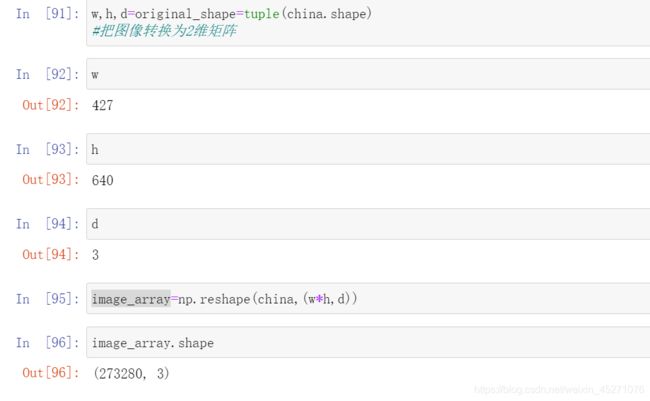
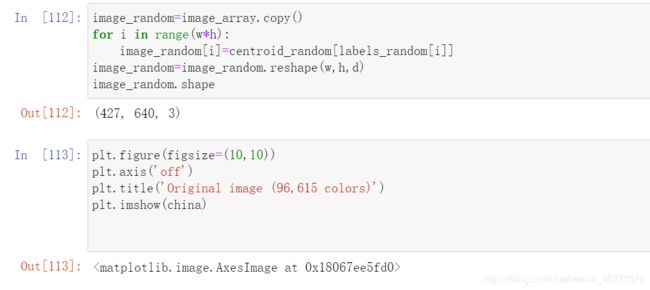
china=load_sample_image("china.jpg")#图片一般是三维数据
china

