Halcon之一维测量
Halcon之一维测量
- 一维测量
-
- 1、基本概念
-
- 1.1 获取图像
- 1.2 创建测量对象
- 1.3 测量
- 1.4 销毁测量对象
- 2 扩展概念
-
- 2.1 辐射校准图像
- 2.2 对齐 ROI 或图像
- 2.3 校正图像
- 2.4 创建测量对象
- 2.5 将结果转换为世界坐标
- 2.6 可视化结果
- 3 编程示例
-
- 3.1 检查保险丝
- 3.2检查铸件
- 3.3 使用模糊测量检查 IC
- 3.4 测量移动 IC 的引线
- 3.5 检查IC
- 4、选择算子
-
- 4.1 获取图像
- 4.2 辐射校准图像
- 4.3 对齐 ROI 或图像
- 4.4 校正图像
- 4.5 创建测量对象
- 4.6 Measure
- 4.7 将结果转换为世界坐标
- 4.8 可视化结果
- 4.9 销毁测量对象
- 5、 与其他方法的关系
-
- 5.1 一维测量的替代方案
- 6、 提示与技巧
-
- 6.1 抑制杂波或噪音
- 6.2 重用测量对象
- 6.3 使用绝对灰度值阈值
- 7、 高级主题
-
- 7.1 模糊测量
- 7.2 灰度值的评估
一维测量
一维测量(也称为一维计量或卡尺)的想法非常直观:沿着预定义的感兴趣区域,边缘的位置主要垂直于感兴趣区域的方向。 这里,边缘被定义为从暗到亮或从亮到暗的过渡。
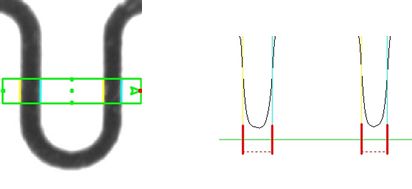
根据提取的边缘,您可以测量零件的尺寸。 例如,您可以通过在零件上放置一个感兴趣的区域并定位其左侧和右侧的边缘来测量零件的宽度。 其效果如图 5.1a 所示,而图 5.1b 显示了相应的灰度值分布。

图 5.1:(a) 测量保险丝; (b) 沿具有提取边缘的测量区域的灰度值分布
除了这些简单的矩形感兴趣区域外,圆弧还可用于测量例如齿轮上的齿轮的宽度。
测量方法的优势在于其易于使用、执行时间短和精度非常高。 只需几个算子,就可以实现高性能应用。
或者,您可以使用 HDevelop 的测量助手,只需点击几下鼠标即可执行测量。 HDevelop 用户指南第 7.4 节第 307 页详细介绍了如何使用此助手进行测量。
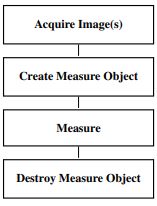
1、基本概念
1.1 获取图像
首先,获取图像。
有关详细信息,请参阅Halcon之图像采集。
1.2 创建测量对象
获取图像后,您可以指定测量位置,即描述要测量的直线或圆弧的位置、方向等。 该信息与一些其他参数一起存储在所谓的测量对象中。
您可以使用所谓的句柄访问度量对象。 与文件句柄类似,使用该工具时需要此句柄。 每次执行测量工具时,都会将此句柄作为参数传递。
在像 C++ 这样的面向对象的语言中,可以使用度量类而不是带有句柄的低层方法。 在这里,创建和销毁是通过标准的面向对象方法实现的。
1.3 测量
然后,您可以通过指定测量对象和一些其他视觉参数(例如最小对比度)来应用测量。 您可以在第 17 页第 3 章的解决方案指南 III-A 中找到有关此步骤的详细信息。
1.4 销毁测量对象
当您不再需要测量对象时,您可以通过将句柄传递给 close_measure 来销毁它。
2 扩展概念
在许多情况下,测量应用程序将比上述更复杂。 其原因是,例如,杂乱或不均匀的照明。 此外,可能需要诸如将特征转换为真实世界单位或结果可视化等后处理。
2.1 辐射校准图像
为实现高精度测量,相机应具有线性响应函数,即图像中的灰度值应与输入能量呈线性关系。 由于某些相机没有线性响应函数,HALCON 提供了所谓的辐射校准(灰度值校准):通过操作符 radiometric_self_calibration 您可以确定相机的逆响应函数(离线),然后将此函数应用于图像 在执行测量之前使用 lut_trans。
2.2 对齐 ROI 或图像
在某些应用程序中,您要测量的直线或圆弧必须相对于另一个对象对齐。
解决方案指南 II-B 第 42 页的 2.4.3.2 节中描述了如何使用基于形状的匹配来执行对齐。
2.3 校正图像
与对齐类似,可能需要校正图像,例如消除镜头畸变。
有关校正图像的详细信息,请参见第 91 页上的第 3.4 节中的解决方案指南 III-C。

2.4 创建测量对象
您可以使用 draw_rectangle2 等操作符交互地教授测量线或圆弧,或从文件 (read_string) 中读取其参数。作为替代方案,它的坐标可以根据其他视觉工具(如 Blob 分析)的结果生成(请参阅第 45 页上对此方法的说明)。特别地,测量线或弧可能需要与如上所述的某个对象对齐。
如果测量总是沿着同一条直线或圆弧进行,您可以离线创建测量对象,然后在销毁它之前多次使用它。但是,如果要对齐测量,则每幅图像的线或弧的位置和方向都会不同。在这种情况下,您必须为每个图像创建一个新的度量对象。此规则的一个例外是,如果只有位置改变而方向没有改变。然后,您可以保留测量对象并通过 translate_measure 调整其位置。
有关详细信息,请参阅解决方案指南 III-A,第 11 页的第 2 章。
2.5 将结果转换为世界坐标
如果您已经校准了您的视觉系统,您可以使用 image_points_to_world_plane 轻松地将测量结果转换为世界坐标。 解决方案指南 III-A 第 26 页第 3.5 节中描述了如何执行此操作。
这在解决方案指南 III-C 第 86 页的 3.3 节中有详细描述。
2.6 可视化结果
可视化边缘位置的最佳方法是使用 gen_contour_polygon_xld 等运算符创建(短)XLD 线段。
有关详细信息,请参阅Halcon之可视化。
3 编程示例
下面的例子简单介绍了HALCON的一维测量工具的使用。 最长的部分是预处理和后处理; 测量本身仅包含两个操作员调用。 解决方案指南 III-A 中描述了更多示例。
3.1 检查保险丝
Example: solution_guide/basics/fuse.hdev
预处理包括测量线的生成。 在示例程序中,这一步是通过将测量对象的参数分配给变量来完成的。
* fuse.hdev: measuring the width of a fuse wire
*
dev_update_window ('off')
dev_close_window ()
* ****
* step: acquire image
* ****
read_image (Fuse, 'fuse')
get_image_size (Fuse, Width, Height)
dev_open_window_fit_image (Fuse, 0, 0, Width, Height, WindowID)
set_display_font (WindowID, 12, 'mono', 'true', 'false')
dev_set_draw ('margin')
dev_set_line_width (3)
dev_display (Fuse)
set_display_font (WindowID, 12, 'mono', 'true', 'false')
disp_continue_message (WindowID, 'black', 'true')
stop ()
* ****
* step: create measure object
* ****
* -> specify ROI
Row := 297
Column := 545
Length1 := 80
Length2 := 10
Angle := rad(90)
gen_rectangle2 (ROI, Row, Column, Angle, Length1, Length2)
* -> create measure object
gen_measure_rectangle2 (Row, Column, Angle, Length1, Length2, Width, Height, 'bilinear', MeasureHandle)
dev_display (ROI)
disp_continue_message (WindowID, 'black', 'true')
stop ()
* ****
* step: measure
* ****
measure_pairs (Fuse, MeasureHandle, 1, 1, 'negative', 'all', RowEdgeFirst, ColumnEdgeFirst, AmplitudeFirst, RowEdgeSecond, ColumnEdgeSecond, AmplitudeSecond, IntraDistance, InterDistance)
disp_continue_message (WindowID, 'black', 'true')
stop ()
* ****
* step: visualize results
* ****
for i := 0 to |RowEdgeFirst| - 1 by 1
    gen_contour_polygon_xld (EdgeFirst, [-sin(Angle + rad(90)) * Length2 + RowEdgeFirst[i],-sin(Angle - rad(90)) * Length2 + RowEdgeFirst[i]], [cos(Angle + rad(90)) * Length2 + ColumnEdgeFirst[i],cos(Angle - rad(90)) * Length2 + ColumnEdgeFirst[i]])
    gen_contour_polygon_xld (EdgeSecond, [-sin(Angle + rad(90)) * Length2 + RowEdgeSecond[i],-sin(Angle - rad(90)) * Length2 + RowEdgeSecond[i]], [cos(Angle + rad(90)) * Length2 + ColumnEdgeSecond[i],cos(Angle - rad(90)) * Length2 + ColumnEdgeSecond[i]])
    dev_set_color ('cyan')
    dev_display (EdgeFirst)
    dev_set_color ('magenta')
    dev_display (EdgeSecond)
    dev_set_color ('blue')
    if (i == 0)
        set_tposition (WindowID, RowEdgeFirst[i] + 5, ColumnEdgeFirst[i] + 20)
    else
        set_tposition (WindowID, RowEdgeFirst[i] - 40, ColumnEdgeFirst[i] + 20)
    endif
    write_string (WindowID, 'width: ' + IntraDistance[i] + ' pix')
endfor
disp_continue_message (WindowID, 'black', 'true')
stop ()
* ****
* step: destroy measure object
* ****
close_measure (MeasureHandle)
dev_update_window ('on')
dev_clear_window ()
现在通过将测量对象应用于图像来执行实际测量。 选择参数使得暗区周围的边缘被分组为所谓的对,返回边缘的位置以及对的宽度和距离。
* ****
* step: measure
* ****
measure_pairs (Fuse, MeasureHandle, 1, 1, 'negative', 'all', RowEdgeFirst, ColumnEdgeFirst, AmplitudeFirst, RowEdgeSecond, ColumnEdgeSecond, AmplitudeSecond, IntraDistance, InterDistance)
disp_continue_message (WindowID, 'black', 'true')
stop ()
程序的最后一部分通过生成具有测量线参数的区域并将边缘位置转换为短 XLD 轮廓来显示结果(见图 5.2)。

3.2检查铸件
Example: hdevelop/Applications/Measuring-2D/measure_arc.hdev
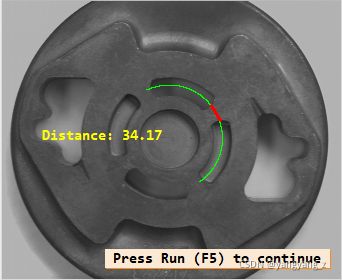
本示例的任务是检查倒角后铸件长孔之间的距离(见图 5.3)。 请注意,为了获得最佳精度,建议将背光与远心镜头结合使用,而不是所描述的设置。
通过使用具有圆形测量 ROI 的测量工具,可以轻松解决此任务。 ROI 的中心放置在铸件的中心; 其半径设置为细长孔距中心的距离。
*  Example for the application of the measure package
* including a lot of visualization operators
*
read_image (Zeiss1, 'zeiss1')
get_image_size (Zeiss1, Width, Height)
dev_close_window ()
dev_open_window (0, 0, Width / 2, Height / 2, 'black', WindowHandle)
set_display_font (WindowHandle, 14, 'mono', 'true', 'false')
dev_display (Zeiss1)
disp_continue_message (WindowHandle, 'black', 'true')
stop ()
* draw_circle (WindowHandle, Row, Column, Radius)
Row := 275
Column := 335
Radius := 107
AngleStart := -rad(55)
AngleExtent := rad(170)
dev_set_draw ('fill')
dev_set_color ('green')
dev_set_line_width (1)
get_points_ellipse (AngleStart + AngleExtent, Row, Column, 0, Radius, Radius, RowPoint, ColPoint)
disp_arc (WindowHandle, Row, Column, AngleExtent, RowPoint, ColPoint)
dev_set_line_width (3)
gen_measure_arc (Row, Column, Radius, AngleStart, AngleExtent, 10, Width, Height, 'nearest_neighbor', MeasureHandle)
disp_continue_message (WindowHandle, 'black', 'true')
stop ()
count_seconds (Seconds1)
n := 10
for i := 1 to n by 1
    measure_pos (Zeiss1, MeasureHandle, 1, 10, 'all', 'all', RowEdge, ColumnEdge, Amplitude, Distance)
endfor
count_seconds (Seconds2)
Time := (Seconds2 - Seconds1) / n
disp_continue_message (WindowHandle, 'black', 'true')
* stop ()
distance_pp (RowEdge[1], ColumnEdge[1], RowEdge[2], ColumnEdge[2], IntermedDist)
* dev_display (Zeiss1)
dev_set_color ('red')
* disp_circle (WindowHandle, RowEdge, ColumnEdge, RowEdge - RowEdge + 1)
disp_line (WindowHandle, RowEdge[1], ColumnEdge[1], RowEdge[2], ColumnEdge[2])
dev_set_color ('yellow')
disp_message (WindowHandle, 'Distance: ' + IntermedDist, 'image', 250, 80, 'yellow', 'false')
* dump_window (WindowHandle, 'tiff_rgb', 'C:\\Temp\\zeiss_result')
close_measure (MeasureHandle)
dev_set_line_width (1)
* disp_continue_message (WindowHandle, 'black', 'true')
stop ()
dev_clear_window ()
Row := 275
Column := 335
Radius := 107
AngleStart := -rad(55) AngleExtent := rad(170)
gen_measure_arc (Row, Column, Radius, AngleStart, AngleExtent, 10, Width, Height, 'nearest_neighbor', MeasureHandle)
现在,可以通过单个操作员调用来测量孔之间的距离:
measure_pos (Zeiss1, MeasureHandle, 1, 10, 'all', 'all', RowEdge, ColumnEdge, Amplitude, Distance)
3.3 使用模糊测量检查 IC
Example: hdevelop/Applications/Measuring-2D/fuzzy_measure_pin.hdev
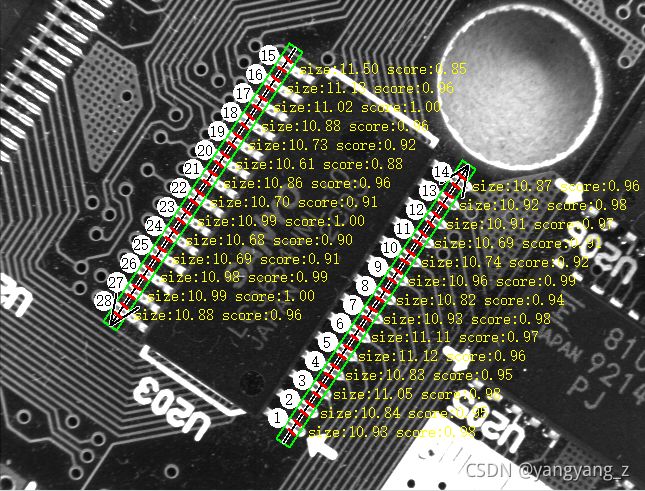
此示例的任务是检查图 5.4 中描述的 IC 的引线宽度和引线距离。
本例中的照明条件非常困难。 这具有每个引线的四个边缘可见的效果。 模糊规则用于将测量限制在正确的(外部)引线上。
* Example for the application of the fuzzy measure tool
* including a lot of visualization operators
*
dev_close_window ()
read_image (Image, 'board/board-06')
get_image_size (Image, Width, Height)
dev_open_window (0, 0, Width, Height, 'black', WindowHandle)
*
* --- Fuzzy Measure:
Row1 := 305.5
Col1 := 375.5
Phi1 := 0.982
Length1 := 167
Length2 := 8
gen_measure_rectangle2 (Row1, Col1, Phi1, Length1, Length2, Width, Height, 'nearest_neighbor', MeasureHandle1)
Row2 := 188.5
Col2 := 202.5
Phi2 := Phi1 - rad(180)
gen_measure_rectangle2 (Row2, Col2, Phi2, Length1, Length2, Width, Height, 'nearest_neighbor', MeasureHandle2)
* Create a fuzzy member function to select edge pairs of size of the chip pins (about 11 Pixels)
create_funct_1d_pairs ([0.0,0.3], [1.0,0.0], FuzzyAbsSizeDiffFunction)
set_fuzzy_measure_norm_pair (MeasureHandle1, 11.0, 'size_abs_diff', FuzzyAbsSizeDiffFunction)
set_fuzzy_measure_norm_pair (MeasureHandle2, 11.0, 'size_abs_diff', FuzzyAbsSizeDiffFunction)
fuzzy_measure_pairs (Image, MeasureHandle1, 1, 30, 0.5, 'positive', RowEdgeFirst1, ColumnEdgeFirst1, AmplitudeFirst1, RowEdgeSecond1, ColumnEdgeSecond1, AmplitudeSecond1, RowEdgeMiddle1, ColumnEdgeMiddle1, FuzzyScore1, IntraDistance1, InterDistance1)
fuzzy_measure_pairs (Image, MeasureHandle2, 1, 30, 0.5, 'positive', RowEdgeFirst2, ColumnEdgeFirst2, AmplitudeFirst2, RowEdgeSecond2, ColumnEdgeSecond2, AmplitudeSecond2, RowEdgeMiddle2, ColumnEdgeMiddle2, FuzzyScore2, IntraDistance2, InterDistance2)
*
* --- Visualization:
dev_display (Image)
* Measuring area
dev_display_measure_object (Row1, Col1, Phi1, Length1, Length2)
dev_display_measure_object (Row2, Col2, Phi2, Length1, Length2)
* Edge pairs
dev_set_draw ('fill')
Pin := 1
dev_display_profile_points ([RowEdgeFirst1,RowEdgeSecond1], [ColumnEdgeFirst1,ColumnEdgeSecond1], Row1, Col1, Phi1, Length1, Length2)
for I := 0 to |ColumnEdgeFirst1| - 1 by 1
    disp_message (WindowHandle, 'size:' + IntraDistance1[I]$'.2f' + ' score:' + FuzzyScore1[I]$'.2f', 'image', RowEdgeSecond1[I], ColumnEdgeSecond1[I] + 10, 'yellow', 'false')
    MRow := RowEdgeSecond1[I] - 5
    MCol := ColumnEdgeSecond1[I] - 20
    dev_set_color ('white')
    gen_circle (Circle, MRow, MCol, 10)
    dev_display (Circle)
    get_string_extents (WindowHandle, Pin, Ascent, Descent, SWidth, SHeight)
    disp_message (WindowHandle, Pin, 'window', MRow - SHeight / 2, MCol - SWidth / 2, 'black', 'false')
    Pin := Pin + 1
endfor
dev_display_profile_points ([RowEdgeFirst2,RowEdgeSecond2], [ColumnEdgeFirst2,ColumnEdgeSecond2], Row2, Col2, Phi2, Length1, Length2)
for I := 0 to |ColumnEdgeFirst2| - 1 by 1
    dev_set_color ('yellow')
    disp_message (WindowHandle, 'size:' + IntraDistance2[I]$'.2f' + ' score:' + FuzzyScore2[I]$'.2f', 'image', RowEdgeFirst2[I], ColumnEdgeFirst2[I] + 10, 'yellow', 'false')
    MRow := RowEdgeFirst2[I] - 5
    MCol := ColumnEdgeFirst2[I] - 20
    dev_set_color ('white')
    gen_circle (Circle, MRow, MCol, 10)
    dev_display (Circle)
    get_string_extents (WindowHandle, Pin, Ascent, Descent, SWidth, SHeight)
    disp_message (WindowHandle, Pin, 'window', MRow - SHeight / 2, MCol - SWidth / 2, 'black', 'false')
    Pin := Pin + 1
endfor
stop ()
close_measure (MeasureHandle1)
close_measure (MeasureHandle2)
3.4 测量移动 IC 的引线
Example: hdevelop/Applications/Measuring-2D/pm_measure_board.hdev
本例的任务是测量芯片引线的位置(见图 5.5)。 由于芯片可能出现在不同的位置和角度,因此必须对齐用于测量的感兴趣区域。

图 5.5:(a) 带有测量 ROI 的模型图像; (b) 测量对齐的 ROI 中的引线
在这种情况下,对齐是通过使用基于形状的匹配搜索芯片上的打印来实现的(请参阅第 113 页的匹配)。
gen_rectangle1 (Rectangle, Row1, Column1, Row2, Column2)
reduce_domain (Image, Rectangle, ImageReduced)
create_shape_model (ImageReduced, 4, 0, rad(360), rad(1), 'none', 'use_polarity', 30, 10, ModelID)
找到打印件后,测量 ROI 的位置将相对于打印件的位置进行转换。
find_shape_model (ImageCheck, ModelID, 0, rad(360), 0.7, 1, 0.5, \
'least_squares', 4, 0.7, RowCheck, ColumnCheck, \
AngleCheck, Score)
hom_mat2d_identity (HomMat2DIdentity)
hom_mat2d_translate (HomMat2DIdentity, RowCheck, ColumnCheck, \
HomMat2DTranslate)
hom_mat2d_rotate (HomMat2DTranslate, AngleCheck, RowCheck, ColumnCheck, \
HomMat2DRotate)
affine_trans_pixel (HomMat2DRotate, Rect1Row, Rect1Col, Rect1RowCheck, \
Rect1ColCheck)
然后,创建测量工具并应用测量。
gen_measure_rectangle2 (Rect1RowCheck, Rect1ColCheck, AngleCheck, \
RectLength1, RectLength2, Width, Height, \
'bilinear', MeasureHandle1)
measure_pairs (ImageCheck, MeasureHandle1, 2, 90, 'positive', 'all', \
RowEdgeFirst1, ColumnEdgeFirst1, AmplitudeFirst1, \
RowEdgeSecond1, ColumnEdgeSecond1, AmplitudeSecond1, \
IntraDistance1, InterDistance1)
3.5 检查IC
Example: hdevelop/Applications/Measuring-2D/measure_pin.hdev
* Pin Measurement: Example for the application of the measure package
* including a lot of visualization operators
*
dev_close_window ()
read_image (Image, 'ic_pin')
get_image_size (Image, Width, Height)
dev_open_window (0, 0, Width / 2, Height / 2, 'black', WindowHandle)
set_display_font (WindowHandle, 14, 'mono', 'true', 'false')
dev_display (Image)
disp_continue_message (WindowHandle, 'black', 'true')
stop ()
* draw_rectangle2 (WindowHandle, Row, Column, Phi, Length1, Length2)
Row := 47
Column := 485
Phi := 0
Length1 := 420
Length2 := 10
dev_set_color ('green')
dev_set_draw ('margin')
dev_set_line_width (3)
gen_rectangle2 (Rectangle, Row, Column, Phi, Length1, Length2)
gen_measure_rectangle2 (Row, Column, Phi, Length1, Length2, Width, Height, 'nearest_neighbor', MeasureHandle)
disp_continue_message (WindowHandle, 'black', 'true')
stop ()
dev_update_pc ('off')
dev_update_var ('off')
n := 100
count_seconds (Seconds1)
for i := 1 to n by 1
    measure_pairs (Image, MeasureHandle, 1.5, 30, 'negative', 'all', RowEdgeFirst, ColumnEdgeFirst, AmplitudeFirst, RowEdgeSecond, ColumnEdgeSecond, AmplitudeSecond, PinWidth, PinDistance)
endfor
count_seconds (Seconds2)
Time := Seconds2 - Seconds1
disp_continue_message (WindowHandle, 'black', 'true')
stop ()
dev_set_color ('red')
disp_line (WindowHandle, RowEdgeFirst, ColumnEdgeFirst, RowEdgeSecond, ColumnEdgeSecond)
avgPinWidth := sum(PinWidth) / |PinWidth|
avgPinDistance := sum(PinDistance) / |PinDistance|
numPins := |PinWidth|
dev_set_color ('yellow')
disp_message (WindowHandle, 'Number of pins: ' + numPins, 'image', 200, 100, 'yellow', 'false')
disp_message (WindowHandle, 'Average Pin Width:  ' + avgPinWidth, 'image', 260, 100, 'yellow', 'false')
disp_message (WindowHandle, 'Average Pin Distance:  ' + avgPinDistance, 'image', 320, 100, 'yellow', 'false')
* dump_window (WindowHandle, 'tiff_rgb', 'C:\\Temp\\pins_result')
disp_continue_message (WindowHandle, 'black', 'true')
stop ()
* draw_rectangle1 (WindowHandle, Row1, Column1, Row2, Column2)
Row1 := 0
Column1 := 600
Row2 := 100
Column2 := 700
dev_set_color ('blue')
disp_rectangle1 (WindowHandle, Row1, Column1, Row2, Column2)
stop ()
dev_set_part (Row1, Column1, Row2, Column2)
dev_display (Image)
dev_set_color ('green')
dev_display (Rectangle)
dev_set_color ('red')
disp_line (WindowHandle, RowEdgeFirst, ColumnEdgeFirst, RowEdgeSecond, ColumnEdgeSecond)
disp_continue_message (WindowHandle, 'black', 'true')
stop ()
close_measure (MeasureHandle)
dev_set_part (0, 0, Height - 1, Width - 1)
dev_display (Image)
disp_continue_message (WindowHandle, 'black', 'true')
stop ()
dev_set_color ('green')
* draw_rectangle2 (WindowHandle, Row, Column, Phi, Length1, Length2)
Row := 508
Column := 200
Phi := -1.5708
Length1 := 482
Length2 := 35
gen_rectangle2 (Rectangle, Row, Column, Phi, Length1, Length2)
gen_measure_rectangle2 (Row, Column, Phi, Length1, Length2, Width, Height, 'nearest_neighbor', MeasureHandle)
stop ()
measure_pos (Image, MeasureHandle, 1.5, 30, 'all', 'all', RowEdge, ColumnEdge, Amplitude, Distance)
PinHeight1 := RowEdge[1] - RowEdge[0]
PinHeight2 := RowEdge[3] - RowEdge[2]
dev_set_color ('red')
disp_line (WindowHandle, RowEdge, ColumnEdge - Length2, RowEdge, ColumnEdge + Length2)
disp_message (WindowHandle, 'Pin Height:  ' + PinHeight1, 'image', RowEdge[1] + 40, ColumnEdge[1] + 100, 'yellow', 'false')
disp_message (WindowHandle, 'Pin Height:  ' + PinHeight2, 'image', RowEdge[3] - 120, ColumnEdge[3] + 100, 'yellow', 'false')
* dump_window (WindowHandle, 'tiff_rgb', 'C:\\Temp\\pins_height_result')
close_measure (MeasureHandle)
dev_set_draw ('fill')
dev_set_line_width (1)
本例的任务是检查 IC 的主要尺寸(见图 5.6)。
在第一步中,测量每个引线的范围和引线之间的距离。 为此,定义了一个包含引线的矩形(见图 5.6a),用于生成测量对象。 这用于提取垂直于矩形长轴的直边对。
gen_measure_rectangle2 (Row, Column, Phi, Length1, Length2, Width, Height, \
'nearest_neighbor', MeasureHandle)
measure_pairs (Image, MeasureHandle, 1.5, 30, 'negative', 'all', \
RowEdgeFirst, ColumnEdgeFirst, AmplitudeFirst, \
RowEdgeSecond, ColumnEdgeSecond, AmplitudeSecond, PinWidth, \
PinDistance)
从提取的直边对中,导出引线的数量、它们的平均宽度和它们之间的平均距离。

图 5.6:测量引线的尺寸:(a) 引线的宽度和它们之间的距离; (b) 引线的长度。
numPins := |PinWidth| avgPinWidth := sum(PinWidth) / |PinWidth| avgPinDistance := sum(PinDistance) / |PinDistance|
第二部分显示测量工具的威力:确定引线的长度。 尽管每条引线的宽度只有几个像素,但这是可能的。 为此,基于包含 IC 两侧引线的矩形生成新的测量对象(见图 5.6b)。 找到的第一条和第二条边之间的距离是上引线的长度,第三条和第四条边之间的距离是下引线的长度。
gen_measure_rectangle2 (Row, Column, Phi, Length1, Length2, Width, Height, \
'nearest_neighbor', MeasureHandle)
measure_pos (Image, MeasureHandle, 1.5, 30, 'all', 'all', RowEdge, \
ColumnEdge, Amplitude, Distance)
4、选择算子
4.1 获取图像
有关图像采集方法,请参阅Halcon之图像采集
4.2 辐射校准图像
Standard:
radiometric_self_calibration, lut_trans
4.3 对齐 ROI 或图像
Operators for aligning ROIs or images are described in the Solution Guide II-B.
4.4 校正图像
Operators for rectifying images are described in the Solution Guide III-C.
4.5 创建测量对象
Standard:
gen_measure_rectangle2, gen_measure_arc, translate_measure
4.6 Measure
Standard: measure_pos, measure_pairs
Advanced:
set_fuzzy_measure, fuzzy_measure_pos, fuzzy_measure_pairs, fuzzy_measure_pairing
4.7 将结果转换为世界坐标
Standard: image_points_to_world_plane
Advanced: gen_contour_region_xld, contour_to_world_plane_xld
More operators for transforming results into world coordinates are described in the Solution Guide III-C.
4.8 可视化结果
Advanced: gen_contour_polygon_xld
Please refer to the operator list for the method Visualization (see section 19.4 on page 315).
4.9 销毁测量对象
Standard:
close_measure
5、 与其他方法的关系
5.1 一维测量的替代方案
边缘提取(亚像素精度)(参见Halcon之边缘提取)
测量边缘参数的一种非常灵活的方法是使用edges_sub_pix 提取边缘轮廓。 这种方法的优点是它可以处理自由形式的形状。 此外,它还允许确定每个边缘点的边缘方向等属性。
6、 提示与技巧
6.1 抑制杂波或噪音
在许多应用中,必须抑制杂波或噪声。 度量运算符提供了多种方法来实现这一点。 最好的一种是增加边缘提取的阈值,以消除微弱的边缘。 此外,可以增加平滑参数的值以平滑不相关的边缘。
将边缘分组时,如果噪声边缘位于“真实”边缘附近并具有相同的极性,则噪声边缘可能会导致错误的分组。 在这种情况下,您可以通过仅选择一系列连续上升沿和下降沿中的最强边沿来抑制噪声边沿。
6.2 重用测量对象
由于创建度量对象需要一些时间,因此我们建议尽可能重用它们。 如果不需要对齐,例如可以离线创建测量对象并为每个图像重复使用。 如果对齐只涉及平移,可以使用 translate_measure 来校正位置。
6.3 使用绝对灰度值阈值
作为边缘提取的替代方案,可以使用算子 measure_thresh 基于绝对灰度值阈值执行测量。 在这里,选择灰度值与给定阈值相交的所有位置。
7、 高级主题
7.1 模糊测量
如果存在不属于测量的额外边缘,HALCON 提供了测量的扩展版本:模糊测量。 该工具允许定义所谓的模糊规则,它描述了良好边缘的特征。 可能的特征是例如位置、距离、灰度值或边缘幅度。 这些函数是用 create_funct_1d_pairs 创建的,并用 set_fuzzy_measure 传递给工具。 根据这些规则,该工具将选择最合适的边。
这种方法的优点是即使使用了非常低的最小阈值或平滑处理,也可以灵活地处理额外的边缘。 这种方法的一个例子是第 69 页上的示例程序 Fuzzy_measure_pin.hdev。
有关详细信息,请参阅解决方案指南 III-A 第 4 章第 33 页。
7.2 灰度值的评估
要完全控制沿测量线或弧的灰度值的评估,您可以使用 measure_projection。 运算符将投影灰度值作为数字数组返回,然后可以使用 HALCON 运算符对其进行进一步处理以进行元组或函数处理(请参阅参考手册中的“元组”和“工具.函数”章节)。 有关详细信息,请参阅解决方案指南 III-A,第 22 页上的第 3.4 节。


