用echarts做风速风向折线图
因为功能需求,需要接收风速(m/s)、风向(度数),来做折线图。看了网上的相关介绍,决定直接用echarts来做风速风向折线图(风向用度数来折线图展示实在不好看),具体效果图如下。

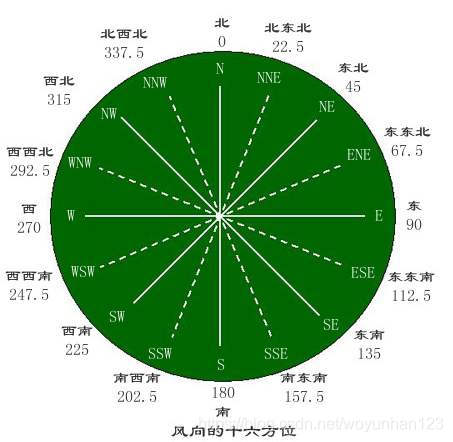
首先来介绍一下风向的方向和风向度数之间的关系.
也就说如果传过来的度数为0,就代表是北风,代表风向的箭头朝下.echarts有个属性symbolRotate来控制拐点图形旋转.
symbolRotate : 180 -windDirection(风向度数)
具体代码如下:
var data= [
            [0, 1,2020-05-01 00:00:00.000000],
            [280, 2,2020-05-16 00:00:00.000000],
            [260, 1,2020-05-07 00:00:00.000000],
            [290, 3,2020-05-08 00:00:00.000000],
            [240, 2,2020-05-15 00:00:00.000000],
            [270, 3,2020-06-11 00:00:00.000000]
        ];
 var dateTime = [];
        var windSpeedList = [];
        var obj;
        console.log(data);
        if (data.length != 0) {
            for (var i = 0; i < data.length; i++) {
                var item = data[i];
                obj = {
                    value: item[1],
                    symbolRotate: 180 - item[0]
                }
                windSpeedList.push(obj);
                dateTime.push( item.item[2]);
            }
            var option = {
                tooltip: {
                    trigger: 'axis',
                    formatter: function(params) {
                        var res = params[0].name;
                        res += '
' + params[0].seriesName + ':' + params[0].value + 'm/s';
                        return res;
                    }
                },
                dataZoom: [
                    {
                        type: 'inside', //鼠标滑动缩放
                        realtime: false,
                        start: 30,
                        end: 70,
                    }
                ],
                grid: {
                    left: '6%',
                    right: '5%',
                    bottom: '10%',
                    containLabel: true
                },

                xAxis: {
                    name: '时间',
                    type: 'category',
                    boundaryGap: false,
                    data: dateTime
                },
                yAxis: {
                    name: 'm/s',
                    type: 'value'
                },
                lineStyle:{
                    normal:{
                        color:'#ecc47e'
                    }
                },
                itemStyle:{
                    normal:{
                        color: '#ecc47e'
                    }
                },
                series: [
                    {
                        name: '风向风速(deg|m/s)',
                        type:'line',
                        symbol: 'arrow',
                        symbolOffset: [0, -3.5],
                        symbolSize: 12,
                        smooth: true, //这句就是让曲线变平滑的
                        data: windSpeedList,
                        itemStyle : {
                            normal : {
                                areaStyle : {
                                    type : 'default',
                                    //渐变色实现
                                    color : new echarts.graphic.LinearGradient(0, 0, 0, 1,//变化度
                                        //三种由深及浅的颜色
                                        [ {
                                            offset : 0,
                                            color : '#ecc47e'
                                        }, {
                                            offset : 0.5,
                                            color : '#ecdbb0'
                                        }, {
                                            offset : 1,
                                            color : '#eaecde'
                                        } ])
                                }
                            }
                        },
                        areaStyle : {}
                    }
                ]
            };
            myChart.setOption(option);//echarts
        } else {
            var option = {
                title: {
                    text: '暂无数据',
                    textStyle: {
                        fontStyle: "normal",
                        fontWeight: "normal"
                    }
                }
            };
            jp.close();
            myChart.setOption(option);//echarts
        }
