From resource planning and inventory control to financial management and budgeting, forecasting is used widely across different industries. Businesses invest heavily in hope of ascertaining future trends. The need for accurate and simple forecasting tools and techniques is apparent in modern industries.
从资源计划和库存控制到财务管理和预算,预测在不同行业中得到广泛使用。 企业大量投资以期确定未来趋势。 在现代工业中,对准确,简单的预测工具和技术的需求显而易见。
介绍 (Introduction)
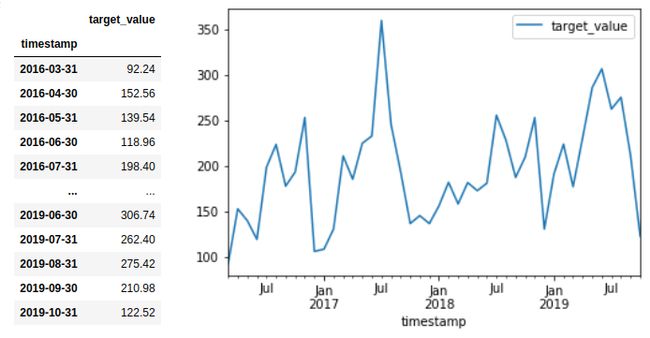
What is a time series? A series of numbers representing some quantity that changes with time. For example — The revenue from the sale of Ginger.
什么是时间序列? 代表一些随时间变化的数量的一系列数字。 例如-出售姜的收入。
Demand Forecasting 需求预测What is meant by time series forecasting? The science of making predictions based on past and present time series data. For example: What will be the demand for the month of November (i.e. on 2019–11–30)?
时间序列预测是什么意思? 基于过去和现在的时间序列数据进行预测的科学。 例如:11月(即2019–11–30)的需求量是多少?
Amazon Forecast
亚马逊预报
A fully managed service that uses modern machine learning methodologies to deliver accurate time-series forecasts. This means that there are no servers to provision, and no machine learning models to build, train, or deploy. One need not know machine learning at all as everything happens under the hood.
一项完全托管的服务,使用现代机器学习方法来提供准确的时间序列预测。 这意味着无需配置服务器,也无需构建,训练或部署机器学习模型。 人们根本不需要了解机器学习,因为一切都在幕后发生。
Fun fact — the e-commerce giant Amazon.com uses the same technology for its forecasting requirements!
有趣的事实-电子商务巨头Amazon.com使用相同的技术来满足其预测要求!
Have you ever used Amazon Forecast to meet your business needs? Have you ever wanted to improve forecasting accuracy? This blog covers several strategies that you can use to obtain better forecasts. Here is the outline:
您是否曾经使用Amazon Forecast来满足您的业务需求? 您是否曾经想提高预测准确性? 该博客涵盖了几种策略,您可以使用它们来获得更好的预测。 这是大纲:
Prerequisites — Basics of Amazon Forecast and what it does to improvise.
先决条件 — Amazon Forecast的基础知识以及即兴发挥的作用。
Data Wrangling — Applying transformations, normalization, and other operations to time series data.
数据整理 —将转换,归一化和其他操作应用于时间序列数据。
Using Amazon Forecast — Overview of the procedure.
使用Amazon Forecast-过程概述。
Obtaining and Postprocessing Forecasts — Using Python to obtain forecasts and tips for postprocessing.
获取和后期处理预测 -使用Python获取后处理的预测和技巧。
Evaluating Forecasts — Using suitable metrics for validation.
评估预测 -使用适当的指标进行验证。
Limitations of Amazon Forecast
亚马逊预报的局限性
Conclusion
结论
先决条件 (Prerequisites)
数据集组-目标,元数据和相关时间序列数据集 (Dataset group — Target, Metadata, and Related time series datasets)
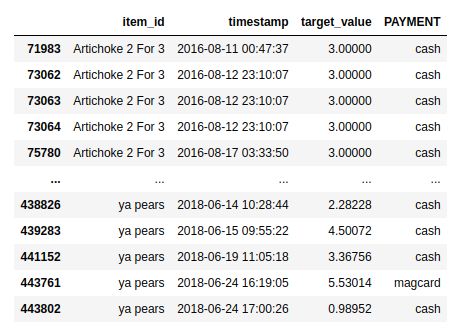
Previously we saw what a time series looks like. Imagine that you run a provision store and you want to forecast the sales of all the categories of products you sell. Amazon Forecast allows you to feed all these time series at once. See the below table for reference.
以前,我们看到了时间序列的样子。 想象一下,您经营一家食品商店,并且想要预测所销售产品的所有类别的销售额。 Amazon Forecast允许您一次输入所有这些时间序列。 请参阅下表以供参考。
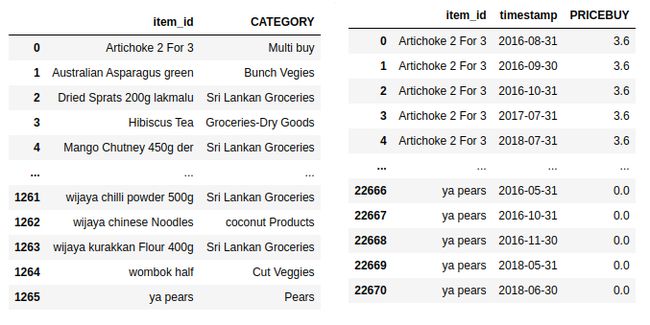
Target dataset 目标数据集Note that you can include up to 10 categorical features besides those specifying name/id, time, and values. This dataset is called the “target dataset”. Moreover, you can include two more datasets — “Metadata dataset” and “Related time series dataset”. More details can be found here. Together these three datasets make a “Dataset group”.
请注意,除了那些指定名称/ ID,时间和值的功能之外,您最多还可以包含10个类别功能。 该数据集称为“目标数据集”。 此外,您可以包括另外两个数据集-“元数据数据集”和“相关时间序列数据集”。 可以在此处找到更多详细信息。 这三个数据集共同构成一个“数据集组”。
Metadata and Related time series datasets respectively 元数据和相关时间序列数据集演算法 (Algorithms)
Amazon Forecast can run 6 different algorithms to make forecasts. Not all of them use all the data provided. However, all of them necessarily need three features specifying name/id, time, and value. These algorithms are:
Amazon Forecast可以运行6种不同的算法进行预测。 并非所有人都使用提供的所有数据。 但是,它们全部都需要三个功能来指定名称/标识,时间和值。 这些算法是:
- DeepAR+ DeepAR +
- CNN-QR (Convolutional Neural Network — Quantile Regression) CNN-QR(卷积神经网络-分位数回归)
- Prophet 预言家
- ARIMA (Auto-Regressive Integrated Moving Average) ARIMA(自回归综合移动平均线)
- NPTS (Non-Parametric Time Series) NPTS(非参数时间序列)
- ETS (Exponential Smoothing) ETS(指数平滑)
We can either run all of them using the AutoML feature or specify one algorithm at a time manually.
我们既可以使用AutoML功能运行它们,也可以手动一次指定一种算法。
域 (Domain)
A dataset domain defines a forecasting use case. Amazon Forecast supports the following dataset domains:
数据集域定义了一个预测用例。 Amazon Forecast支持以下数据集域:
• RETAIL — eg. Retail demand
•零售-例如。 零售需求
• INVENTORY_PLANNING — eg. Supply chain and inventory planning
•INVENTORY_PLANNING-例如 供应链和库存计划
• EC2 CAPACITY — eg. Amazon Elastic Compute Cloud (Amazon EC2) capacity
•EC2容量-例如。 Amazon Elastic Compute Cloud(Amazon EC2)容量
• WORK_FORCE — eg. Workforce/attrition
•WORK_FORCE-例如。 劳动力/损耗
• WEB_TRAFFIC — eg. Web traffic
•WEB_TRAFFIC-例如。 网络流量
• METRICS — eg. Revenue and cash flow
•METRICS-例如。 收入和现金流量
• CUSTOM — All other
•自定义-所有其他
The names of the necessary features in the dataset change according to the domain chosen. For example, for forecasting demand, we may select RETAIL and the feature names should be — item_id, timestamp, and target_value respectively. More details can be found here.
数据集中必需要素的名称根据所选域而变化。 例如,为了预测需求,我们可以选择RETAIL,要素名称应分别为— item_id,timestamp和target_value。 可以在此处找到更多详细信息。
数据整理 (Data Wrangling)
Amazon Forecast was developed to deliver accurate forecasts. The use of additional datasets, AutoML, and appropriate DOMAIN also helps. However, there are many techniques to further improve forecasting accuracy. Fortunately, most of these are available with scikit-learn or scipy libraries.
Amazon Forecast旨在提供准确的预测。 使用其他数据集,AutoML和适当的DOMAIN也有帮助。 但是,有许多技术可以进一步提高预测准确性。 幸运的是,其中大多数都可以通过scikit-learn或scipy库获得。
The dataset used for demonstration is available on Kaggle as — Retail grocery store sales from 2016–2019. The dataset comes from a retail grocery store and is regarding the purchases made by customers over a 3 year period (2016–19). You will find features such as UNITS, PRICESELL, NAME, and PAYMENT for each customer along with the time of transaction. Here we are concerned with forecasting a feature that was engineered by multiplying “UNITS” and “PRICESELL”. We intend to forecast these values for categories under “NAME” (eg. Ginger).
用于演示的数据集可在Kaggle上获得,例如- 2016–2019年的零售杂货店销售额 。 该数据集来自一家零售杂货店,涉及三年(2016-19年)内客户的购买情况。 您会为每个客户找到诸如UNITS,PRICESELL,NAME和PAYMENT之类的功能以及交易时间。 在这里,我们关心的是预测通过乘以“ UNITS”和“ PRICESELL”而设计的功能。 我们打算针对“名称”下的类别(例如Ginger)预测这些值。
1.转变 (1. Transformations)
These are mathematical functions applied to time series data in order to make patterns apparent for an algorithm to learn.
这些是应用于时间序列数据的数学函数,以使模式对于算法学习变得明显。
Box-Cox Transform: This technique attempts to impart data a normal distribution and stabilize the variance. The numbers however must be positive. The optimal parameter for stabilizing variance and minimizing skewness is estimated through the Maximum Likelihood Method. Often, a small number such as 0.00001 is added before finding the natural logarithm. This is done to ensure numerical stability.
Box-Cox变换:此技术试图赋予数据正态分布并稳定变化。 但是,数字必须为正。 通过最大似然法估计用于稳定方差和最小化偏斜的最佳参数。 在查找自然对数之前,通常会添加一个小数,例如0.00001。 这样做是为了确保数值稳定性。
Yeo-Johnson Transform: Similar to the Box-Cox transform but it allows negative numbers.
Yeo-Johnson变换:与Box-Cox变换类似,但它允许使用负数。
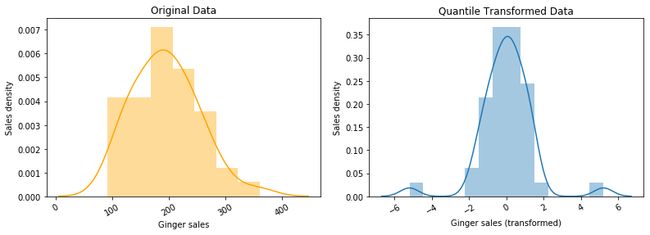
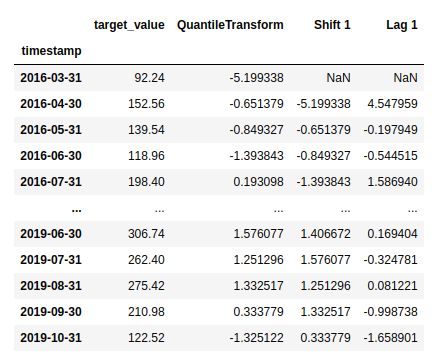
Quantile Transform: Generally used to impart a uniform or normal distribution to data by matching quantiles of data with the target distribution.
分位数变换:通常用于通过使数据分位数与目标分布相匹配来赋予数据均匀或正态分布。
2.缩放,标准化和标准化 (2. Scaling, Normalization, and Standardization)
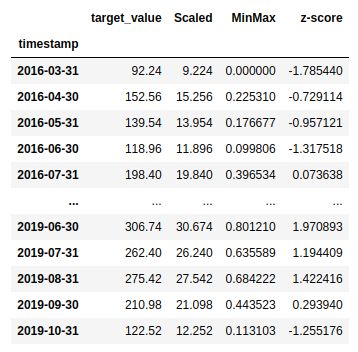
- Scaling refers to increasing or decreasing the relative size of time series values. For example, scaling down by 100 means dividing by 100. This is useful especially when numbers are large but have small variance. 定标是指增加或减小时间序列值的相对大小。 例如,缩小100表示除以100。这在数字较大但方差较小的情况下尤其有用。
- Normalization techniques ensure that the data falls in a certain range. They help reduce numerical complexity and result in shorter algorithm run times. Min-Max scaling is most popular. It ensures that numbers fall in [0, 1]. For certain applications demanding positive values, it may be useful to substitute 0 with an extremely small positive number like 0.00001. 规范化技术可确保数据落入一定范围内。 它们有助于降低数值复杂度并缩短算法运行时间。 最小-最大缩放是最受欢迎的。 它确保数字落在[0,1]中。 对于某些需要正值的应用,用极小的正数(例如0.00001)替换0可能会很有用。
- The well-known technique of z-score standardization ensures that the data has a mean = 0 and variance = 1. This is achieved by subtracting the observations by their mean value and dividing by their standard deviation. It is useful when assuming fixed statistics for any process. It also helps reduce numerical complexity and results in shorter algorithm run times. z分数标准化的著名技术可确保数据的平均值= 0,方差=1。这是通过将观测值减去其平均值并除以其标准偏差来实现的。 在为任何过程假设固定统计信息时,此功能很有用。 它还有助于降低数值复杂度并缩短算法运行时间。
In practice, using a combination of transformations as well as scaling, normalization, or standardization yields the best results. For example, you may apply min-max normalization so that the data becomes non-negative or try scaling so that data is reasonably small for transformation. Scaling, normalization or standardization may once again be applied after the transformation if found to be necessary.
实际上,结合使用转换以及缩放,归一化或标准化可产生最佳结果。 例如,您可以应用最小-最大规格化,以使数据变为非负数,或尝试缩放以使数据足够小以进行转换。 如果发现必要,可以在转换后再次应用缩放,规范化或标准化。
Note that after obtaining forecasts, the inverse of each operation is applied to forecasts in the reverse order, to bring to original data-space.
请注意,在获得预测后,每个操作的逆运算将以相反顺序应用于预测,以带到原始数据空间。
3.平稳性和差异性 (3. Stationarity and differencing)
- A stationary time series is one whose properties do not depend on the time at which the series is observed. Such time series do not have a trend or seasonality. 固定时间序列是一种不依赖于观测时间序列的时间序列。 这样的时间序列没有趋势或季节性。
- Mathematically, 3 conditions must hold — mean and variance must be constant and there should not be autocorrelation within the time series. Making a decomposition plot may be useful in visualizing this. 从数学上讲,必须满足3个条件-均值和方差必须恒定,并且在时间序列内不应存在自相关。 制作分解图可能对可视化很有用。
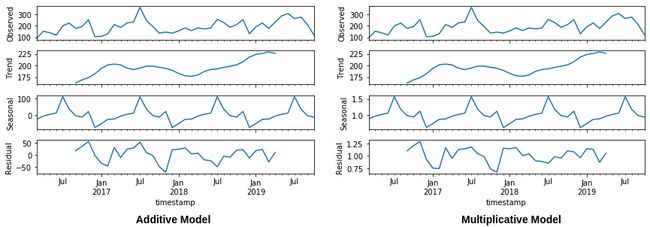
- Time series may be modeled in two ways- additive and multiplicative. Time series values are expressed as a summation of components in the former and product in the latter. The image below illustrates the same. Using decomposition plots to visualize both (additive and multiplicative models) will help you understand your time series better. 时间序列可以两种方式建模:加法和乘法。 时间序列值表示为前者和后者乘积的总和。 下图说明了相同的情况。 使用分解图可视化(加法模型和乘法模型)将有助于您更好地了解时间序列。
The level is the average value of the time series. While trend indicates the upward or downward movement of the time series, seasonality indicates variations that occur at fixed intervals. The residual is what remains when both are removed from the observed time series.
级别是时间序列的平均值。 趋势指示时间序列的向上或向下移动,而季节性指示以固定间隔发生的变化。 当将两者从观察到的时间序列中删除时, 剩下的就是剩余的 。
- Algorithms like ARIMA assume stationarity and it may be useful to make your data stationary. While transformations stabilize variance, how do we stabilize mean? Differencing! ARIMA之类的算法假定平稳,可能对保持数据平稳很有用。 当转换稳定方差时,我们如何稳定均值? 差异!
- Differencing basically means taking differences of numbers at regular intervals (called “lag”). 基本上,差异是指按规则的时间间隔(称为“滞后”)进行数字差异。
You may want to try with different lags and check if the resulting time series is stationary. You may also like to perform unit root tests such as Kwiatkowski–Phillips–Schmidt–Shin (KPSS) or Dickey-Fuller to check whether differencing is a requirement. Shown below is an example of variance stabilization followed by mean stabilization.
您可能需要尝试不同的滞后时间,并检查所得的时间序列是否平稳。 您可能还想执行单位根测试,例如Kwiatkowski–Phillips–Schmidt–Shin(KPSS)或Dickey-Fuller,以检查是否需要差异。 下面显示的是方差稳定后均值稳定的示例。
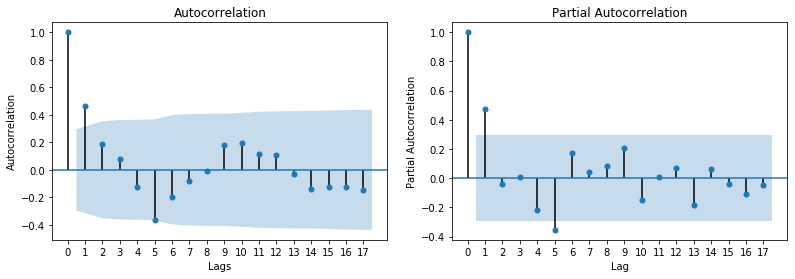
- Autocorrelation is said to exist if numbers at certain intervals are correlated. You may want to use the Durbin-Watson test for this. Another great way of testing for autocorrelations or even partial autocorrelation is using ACF and PACF plots such as those shown below. The lags for which values fall outside the critical limits (blue ribbon) are correlated. 如果以一定间隔对数字进行关联,则称存在自相关。 您可能需要为此使用Durbin-Watson检验。 测试自相关或什至部分自相关的另一种很好的方法是使用ACF和PACF图,如下所示。 值超出临界限值(蓝带)的滞后相关。
That was a lot of math and a lot of fun! Now that we know the best practices of preprocessing, let’s look at using Amazon Forecast.
那是很多数学,很多乐趣! 既然我们知道了预处理的最佳实践,那么让我们来看一下使用Amazon Forecast。
使用亚马逊预测 (Using Amazon Forecast)
Shown here is a simple flowchart for the entire process.
这里显示的是整个过程的简单流程图。
Steps involved in making forecasts 进行预测所涉及的步骤Forecasts may be made either interactively on the console or programmatically using configured Jupyter Notebooks.
可以在控制台上交互式地进行预测,也可以使用配置的Jupyter Notebook以编程方式进行预测。
获取和后处理预测 (Obtaining and Postprocessing Forecasts)
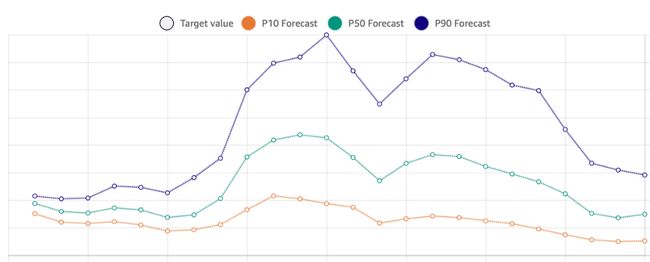
- On the console in the “Forecast lookup” section, Amazon Forecast provides forecasts that look like this: 在“预测查找”部分的控制台上,Amazon Forecast提供的预测如下:
What are p10, p50, and p90 values? These are prediction quantiles. Say for example p10 = 25. This means that in reality, 10% of the time the value will be below 25. These values are useful when you want to stock just enough to sell everything and not have anything remaining. Similarly, say p90 = 30. This means that in reality, 90% of the time the value will be below 30. These are useful when you want to have enough to not go out of stock and have something remaining. Thus, p50 values may be regarded as a more tactful selection. In short, p50 represents the point forecasts while p10 and p90 represent the uncertainty associated with it. Without prediction quantiles, point forecasts have limited value for downstream decision making.
什么是p10,p50和p90值? 这些是预测分位数。 假设p10 =25。这意味着实际上,有10%的时间该值会低于25。当您要存货以出售所有商品而没有剩余商品时,这些值很有用。 类似地,假设p90 =30。这实际上意味着90%的时间该值将低于30。当您想要有足够的余量以免缺货并且有剩余时,这些功能很有用。 因此,p50值可以被认为是一种更明智的选择。 简而言之,p50代表点预测,而p10和p90代表与之相关的不确定性。 如果没有预测分位数,则点预测对于下游决策的价值有限。
- To obtain forecasts in your Jupyter Notebook, configure AWS CLI. Next, you may want to use the following code to obtain forecasts. 要在Jupyter Notebook中获取预测,请配置AWS CLI。 接下来,您可能需要使用以下代码来获取预测。
def CreateForecast(project, forecast, predictor_arn, forecastquery, ItemList, MyItem):
    forecastName = project + "_forecast"

    create_forecast_response = forecast.create_forecast(
        ForecastName = forecastName,
        PredictorArn = predictor_arn
    )

    forecast_arn = create_forecast_response['ForecastArn']


    while True:
        status = forecast.describe_forecast(ForecastArn=forecast_arn)['Status']
        if status in ('ACTIVE', 'CREATE_FAILED'): break
        time.sleep(10)


    forecasts = []
    for item in ItemList:
        forecastResponse = forecastquery.query_forecast(
            ForecastArn = forecast_arn,
            Filters = {
                MyItem: str(item)
            }
        )

        forecasts.append([item, forecastResponse])

    pickle.dump(forecasts, open("forecasts.pickle", "wb"))

    return


session = boto3.Session(region_name = region)
forecast = session.client(service_name = 'forecast')
forecastquery = session.client(service_name = 'forecastquery')


project = # Project name of choice
predictor_arn = # From "Predictors" section of Amazon Forecast console
MyItem =  # First feature in the target dataset, containing category names. eg. item_id
ItemList = [
  # List of categories you want to make forecasts for
]


# Store forecasts as forecasts.pickle
CreateForecast(project, forecast, predictor_arn, forecastquery, ItemList, MyItem)
You will need to parse it to bring to a format that suits your needs.
您将需要对其进行解析,以使其适应您的需求。
- Once you have your forecasts, apply the inverse operations in the reverse order as explained before. Your forecasts will now be in the original data space. It is a good practice to report any results only after doing so. 有了预测后,按照相反的顺序应用逆运算。 您的预测现在将在原始数据空间中。 最好仅在报告结果后再报告。
- In certain cases, depending upon the values, the choice of transformations and the algorithm chosen, you may obtain forecasts that do not meet your needs or convey no physical meaning. For example- negative values for the number of products sold. One approach is to substitute negatives with 0. The physical interpretation of this is that you will not be able to sell any products if you keep producing them at this rate. Based on this, try to sell previous products before making new ones. 在某些情况下,取决于值,转换的选择和选择的算法,您可能会获得不满足您的需求或没有任何物理意义的预测。 例如-所售产品数量的负值。 一种方法是用0代替负数。这的物理解释是,如果继续以这种速度生产它们,您将无法出售任何产品。 基于此,在制造新产品之前,请尝试出售先前的产品。
- Another unfavorable condition is infinitely large forecasts. In this case, try using a different transformation ensuring numerical stability followed by Min-Max normalization. Infinitely small values may almost always be approximated to 0. 另一个不利条件是无限大的预测。 在这种情况下,请尝试使用不同的变换来确保数值稳定性,然后进行最小值-最大值归一化。 无限小的值几乎总是近似于0。
- Some of the problems mentioned above may be avoided by ensuring that the inverse operations are carried out correctly. In certain cases (eg. Box-Cox transform) you may need to use bias-corrected inverse transform. 通过确保正确执行逆运算可以避免上述某些问题。 在某些情况下(例如Box-Cox变换),您可能需要使用偏差校正的逆变换。
评估预测 (Evaluating Forecasts)
So how do we evaluate whether the forecasts are good? One way is to plot them. If there appears to be continuity, chances are these are good forecasts. However, numerical benchmarks are a better option. Internally, Amazon Forecast makes use of RMSE and Quantile Loss for evaluation. You can find these values in the “Predictors” section of the console. To evaluate your forecasts, you will need to partition your data (raw, before operations) and use the last few observations for validation. Notably, this should be done for each time series and the mean value expresses the loss in the system. So let’s look at some evaluation metrics.
那么,我们如何评估预测是否良好? 一种方法是绘制它们。 如果似乎存在连续性,那么这些机会就是很好的预测。 但是,数字基准是更好的选择。 在内部,Amazon Forecast利用RMSE和分位数损失进行评估。 您可以在控制台的“预测变量”部分中找到这些值。 要评估您的预测,您将需要对数据进行分区(原始数据,然后进行操作),并使用最后的几个观察结果进行验证。 值得注意的是,应该针对每个时间序列执行此操作,并且平均值表示系统中的损失。 因此,让我们看一些评估指标。
i) Weighted Quantile Loss
i)加权分位数损失
This loss function calculates how far the forecast is from actual demand in either direction. This metric helps capture the inherent bias in each quantile. The k-quantile loss is expressed as follows:
该损失函数计算预测值与任一方向上的实际需求之间的距离。 此度量标准有助于捕获每个分位数中的固有偏差。 k分位数的损失表示为:
ii) RMSE
ii)RMSE
The Root Mean Square Error in forecasts is the most common metric used to determine how far the forecasts are from the ground truth. It is useful in penalizing larger errors. It increases with the variance of the frequency distribution of errors. It is expressed as follows:
OOT 中号 小号 EANêquare在RROR预测是用来确定预测多远是从地面真理的最常见的指标将R。 在惩罚较大的错误时很有用。 它随着误差频率分布的变化而增加。 表示如下:
iii) MAE
iii)MAE
The Mean Absolute Error in prediction is another metric useful when all errors must be penalized on the same level. It is smaller than RMSE in magnitude. It is expressed as follows:
在M EAN 一个 bsoluteéRROR的预测是另一种有用的指标,当所有的错误必须在同一水平进行处罚。 它的大小小于RMSE。 表示如下:
iv) MASE
iv)MASE
The Mean Absolute Scaled Error is scale-independent as opposed to the others mentioned. It is the ratio of MAE in forecasts and the naïve-MAE in training data. It is <1 if it arises from a better forecast than the average naïve forecast computed on the training data. Conversely, it is > 1 if the forecast is worse than the average naïve forecast computed on the training data. It is expressed as follows:
所述M EAN 甲 bsolute 小号 caledëRROR是规模无关,而不是所提到的其他人。 它是预测中的MAE与训练数据中的朴素MAE的比率。 如果它来自比对训练数据计算的平均天真的预测更好的预测,则它小于1。 相反,如果预测比根据训练数据计算的平均天真的预测差,则该值> 1。 表示如下:
You may also like to visualize errors in each time series using Bar Plots. Looking at errors distinctly is useful in controlling them.
您可能还希望使用条形图可视化每个时间序列中的错误。 清楚地查看错误对于控制它们很有用。
亚马逊预报的局限性 (Limitations of Amazon Forecast)
While Amazon Forecast is a wonderful tool for forecasting, it comes with limitations. Although the documentation explains them in detail, here are the most commonly encountered ones:
尽管Amazon Forecast是一种出色的预测工具,但它具有局限性。 尽管文档详细解释了它们,但以下是最常遇到的问题:
- Only 13, 10, and 25 features are allowed in target, metadata, and related time series datasets respectively. You may have to choose between features in case you have more. 目标,元数据和相关的时间序列数据集中分别仅允许使用13、10和25个功能。 如果您有更多功能,则可能必须在功能之间进行选择。
- Forecast horizon must be the lesser value between — 500 and ⅓ the size of the target dataset. 预测范围必须是介于目标数据集大小的500到1/3之间的较小值。
- DeepAR+, which generally provides the best estimates, works only when the number of observations is > 300. 通常提供最佳估计的DeepAR +,仅在观察次数> 300时有效。
- Only DeepAR+ and CNN-QR support hyperparameter tuning. 仅DeepAR +和CNN-QR支持超参数调整。
结论 (Conclusion)
Techniques to obtain better results such as transformations, normalization, and differencing were discussed. They may be used with Amazon Forecast to obtain superior results. Financial Managers, Business Analysts, and many others within a Supply Chain may use the many strategies, feed in data to Amazon Forecast, and easily make accurate forecasts for planning, management, and control while staying ahead of their competition.
讨论了获得更好结果的技术,例如变换,归一化和差分。 它们可以与Amazon Forecast一起使用以获得更好的结果。 供应链中的财务经理,业务分析师和许多其他人员可以使用许多策略,将数据输入到Amazon Forecast,并在保持竞争优势的同时轻松地为计划,管理和控制做出准确的预测。
翻译自: https://medium.com/searce/how-to-make-better-predictions-with-amazon-forecast-2444ef385fa8
